From forecast to portfolio
Measured · Project · research evidence · July 2026 · sources: NA-IPCA Methodology and Evidence Report (July 2026) and technical note A Note on the Unit-Gross Reporting Basis (10 July 2026) · All projects
What I built
- The rolling protocol: monthly refits on the previous 120 months of 132 characteristics for Core stocks (a median of 1,990 stocks a month, 1,335 to 3,150; 1,244,002 stock-months from 12,703 stocks; Characteristic Geometry, p. 17), and one mean–variance rule that sets every model’s weights on individual stocks.
- A benchmark family on that protocol: FF5, RP-PCA, IPCA, QZ-IPCA, and NA-IPCA with and without the intercept rule.
- Month-by-month diagnostics of how closely the models’ forecasts agree.
- For comparability, every model reported at the same total position size each month, long plus short (gross exposure), the usual normalisation on a systematic desk (technical note, 10 July 2026).
Why it matters on a desk Two checks a desk can reuse. First, near-identical forecasts gave books with typical weight similarity 0.83, and the gap traces to a small fixed ridge in the risk model: audit the optimiser before crediting the forecast. Second, the edge is not stable: the intercept rule’s Sharpe ratio is 2.49 over all 618 months but 1.12 from October 2007 (206 months). Books are compared at equal total position size, long plus short.
Skills and tools rolling out-of-sample design mean–variance portfolio construction latent-factor models (IPCA, RP-PCA) performance, drawdown and turnover accounting Python
Read with care. Returns are before trading costs unless stated. These are working documents, not a paper; Characteristic Geometry holds the formal results. A Sharpe ratio near 2.5 with a −3.9% worst drawdown over five decades compares models inside one protocol, not an achievable return: full point-in-time availability of the data is not yet independently verified (pp. 39, 45), and the characteristic library reflects today’s knowledge. Nothing here establishes live performance, capacity or market impact.
The setting
Nearly identical forecasts can give different portfolios, and each backtest’s book size is an accident of estimation. How should models be compared? Core stocks (U.S. stocks excluding micro caps) are described by 132 characteristics; models are refitted monthly on the previous 120 months, and one mean–variance rule forms each month’s long–short portfolio: 618 months, June 1973 to November 2024. IPCA (instrumented principal component analysis, a standard characteristic-based factor model) uses the plain ruler; QZ-IPCA switches to the characteristic ruler; NA-IPCA also estimates a capped intercept, the part of expected return that no factor in this model explains.
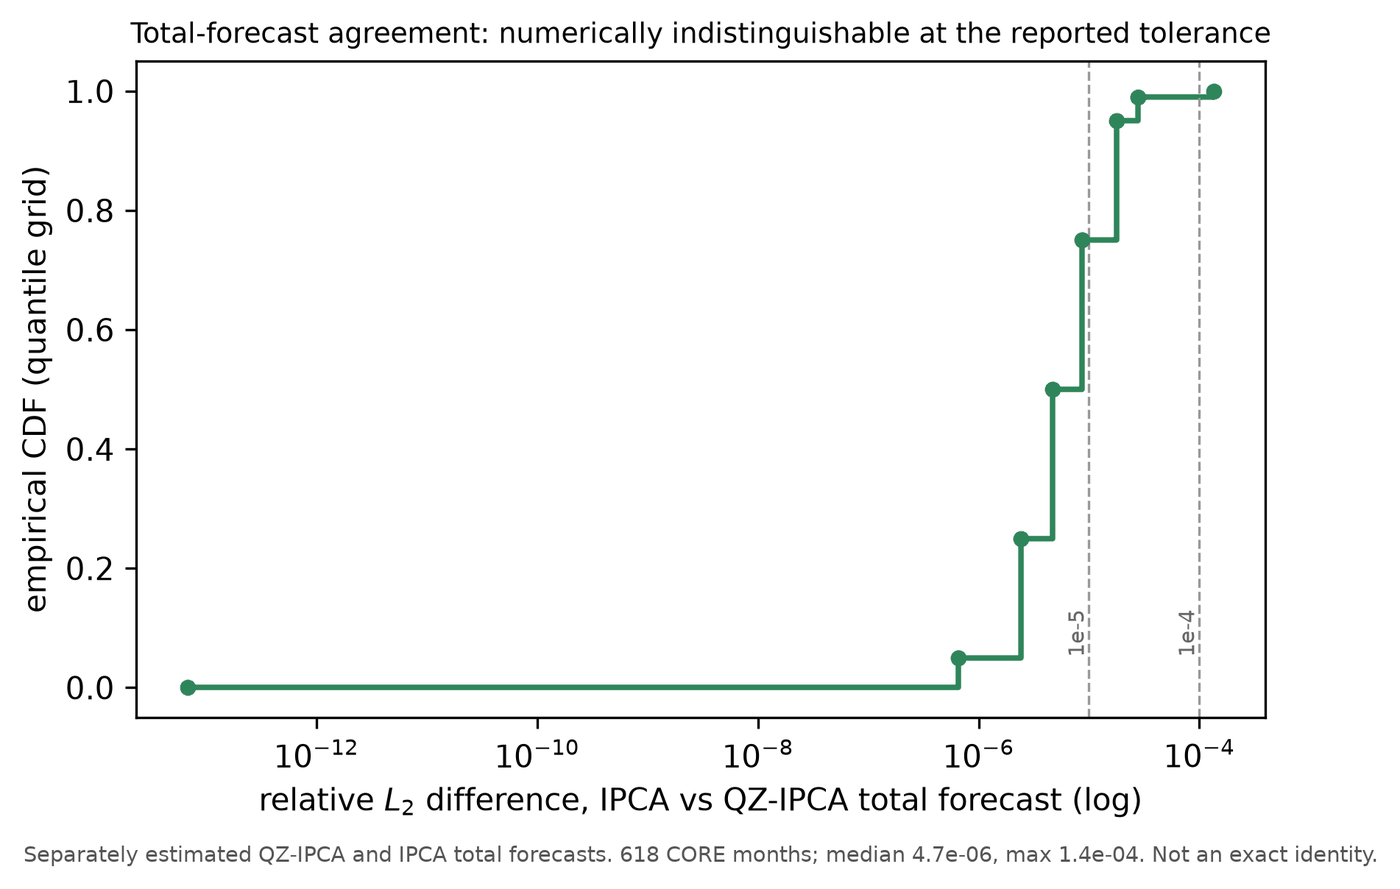
Exhibit 1: The forecasts agree in every month
 (opens the full-size image in a new tab)
Key takeaway. The two forecasts differ by a median of 4.7 parts in a million, at most 1.4 in ten thousand. Yet in Characteristic Geometry the portfolios’ typical weight similarity is 0.83 (1 = identical proportions, 0 = no overlap). The gap traces to a small fixed constant (a ridge) added to each factor’s risk in the ruler’s units; without it the weights essentially coincide. Neither ruler is claimed to give the better risk model.
Exhibit 2: Compare models per unit of position size
| Model | Mean book size, raw | Sharpe ratio, raw / unit | Max drawdown, raw / unit | Turnover, raw / unit |
|---|---|---|---|---|
| FF5 | 1.94 | 0.73 / 0.68 | −36.6% / −20.7% | 0.65 / 0.33 |
| RP-PCA | 0.53 | 1.53 / 1.48 | −6.8% / −13.4% | 0.18 / 0.34 |
| IPCA | 3.74 | 0.46 / 0.64 | −96.0% / −34.6% | 1.37 / 0.38 |
| QZ-IPCA | 2.32 | 0.95 / 1.00 | −25.5% / −16.6% | 0.82 / 0.35 |
| NA-IPCA with intercept | 509.18 | 2.41 / 2.47 | n.m. / −3.9% | 240.95 / 0.47 |
Raw weights (inverse covariance times the forecast) against the same weights rescaled each month to a total position size (long plus short) of one (“unit”); book size = total position size. n.m. = not meaningful. Unit turnover (monthly) divides raw turnover by the book size: a proxy, not reconstructed trades. FF5 = Fama–French five factors; RP-PCA = risk-premium PCA. Source: technical note A Note on the Unit-Gross Reporting Basis, Table 1, p. 3; volatilities from the evidence report, Table 2, p. 3.
Key takeaway. Per unit of position size, IPCA’s maximum drawdown is −34.6% rather than −96.0% and its Sharpe ratio 0.64 rather than 0.46. Fix the book size before comparing turnover. Equal book size is still not equal risk: annual volatility per unit runs from 3.1% (NA-IPCA) to 6.1% (IPCA), so compare drawdowns at equal volatility. The NA-IPCA row (2.47) omits the risk adjustment for unstable intercept estimates; with it, the evidence report gives 2.49.
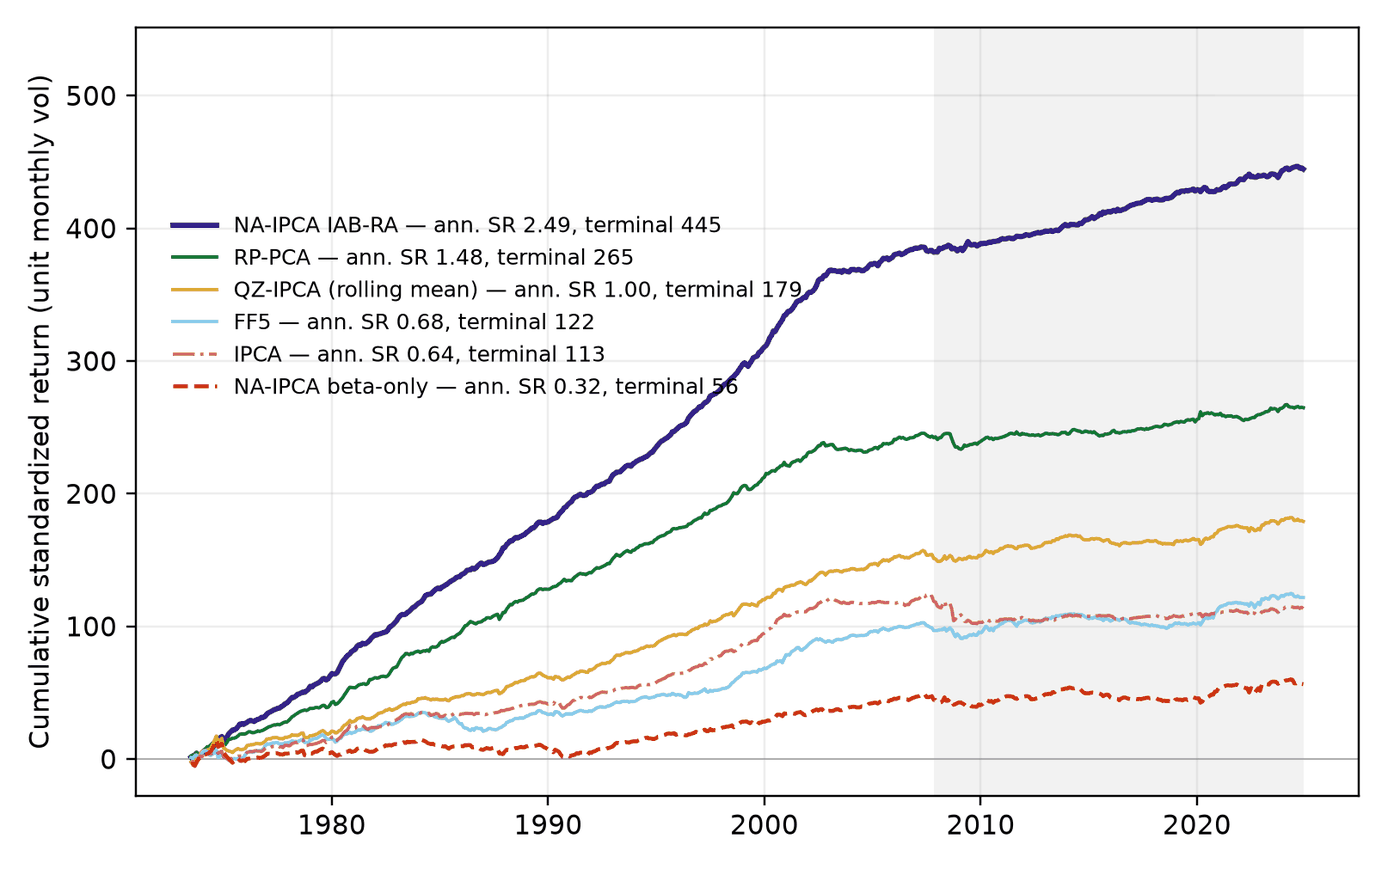
Exhibit 3: The model family on one footing
 (opens the full-size image in a new tab)
Key takeaway. The complete intercept rule separates NA-IPCA from every factor-only portfolio (Sharpe ratio 2.49 against 0.32 without it), but every slope falls after the late 2000s: from October 2007 (206 months), 1.12 against 0.16 (Table 4). Characteristic Geometry tests this block on average return: among Core stocks, 0.20 percentage points a month more, 95% interval [−0.07, 0.41], p = 0.11 (Table VI, p. 33). On the paper’s 594 months from June 1975, the complete rule’s Sharpe ratio falls from 3.97 to 3.03 to 1.13 across three 198-month blocks (p. 63).
Where this connects
- Characteristic Geometry: why nearly equal forecasts give different weights, the intercept’s value within one fit, and paired inference across three versions of the ruler (only one Sharpe-ratio gain over IPCA has an interval excluding zero).
- Characteristic Libraries: the same question for how a characteristic library is written.
- Related projects: Universes, trading costs and backtest checks (where the advantage holds and what it costs) · NA-IPCA toolkit (the estimation code behind Characteristic Geometry’s 618 rolling windows).