Universes, trading costs and backtest checks
Measured · Project · research evidence · July 2026 · source: institutional research brief Adaptive Characteristic Geometry in Systematic Equity Portfolios (10 July 2026) · All projects
What I built
- Universe-by-universe comparisons on one rolling protocol: 618 months; Core, Mega, Large, Small and Micro stocks.
- Proxy-cost curves recomputed at every one-way charge from 0 to 200 bp.
- The checklist in Exhibit 3, which states where each check on a backtest is done in this section and the papers, and where it is still missing.
Why it matters on a desk Before a signal reaches a book, a desk asks where it works, what it costs and whether the backtest can be trusted. This page answers the first two descriptively, with the costs as a sensitivity check, and lists the checks every result in this section has passed or still lacks.
Skills and tools universe construction transaction-cost sensitivity sample splits and interval reporting backtest validation
Read with care. Returns are before trading costs unless stated, and the brief reports no confidence intervals. Its NA-IPCA rule uses the intercept without the risk adjustment for unstable intercept estimates; Characteristic Geometry reports a Sharpe ratio of 2.47 without and 2.49 with it on the same 618 months (p. 61). The characteristic library reflects today’s knowledge, so every backtest here carries some hindsight. The brief is a research communication, not a published paper or investment advice.
The setting
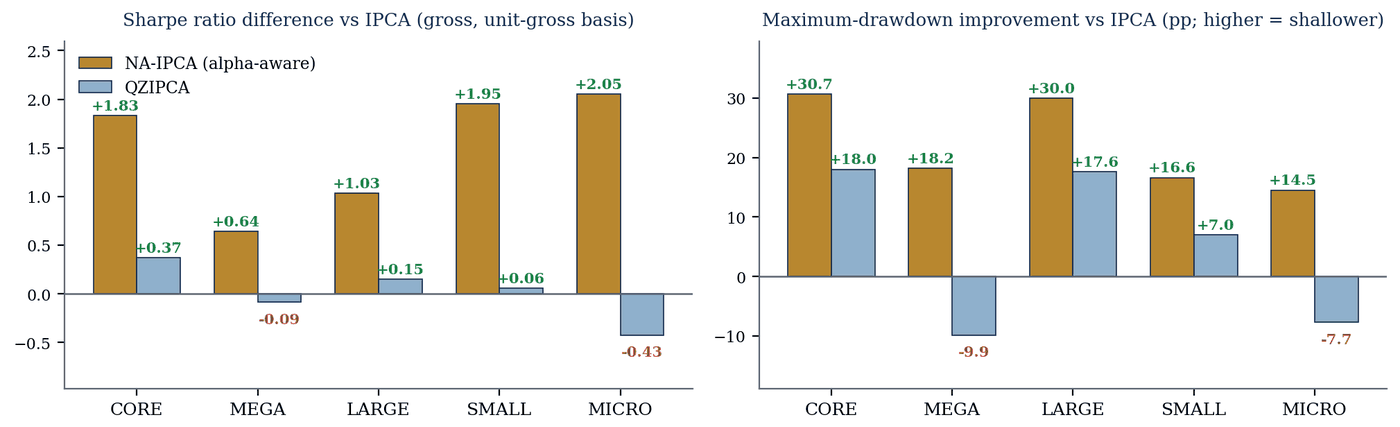
Two questions matter before any model reaches a book: does its advantage hold across stock-size universes, and how sensitive is it to trading costs? A research brief answers both descriptively on one rolling protocol: 618 months, June 1973 to November 2024, with positions scaled each month to a total size (long plus short) of one. IPCA (instrumented principal component analysis, a standard characteristic-based factor model) uses the plain ruler. QZ-IPCA changes only the ruler, to the characteristic ruler. NA-IPCA uses the characteristic ruler and adds the intercept (the part of expected return that no factor in the model explains), with a cap on how much it may carry.
Exhibit 1: Where across universes the models differ
 (opens the full-size image in a new tab)
Key takeaway. NA-IPCA with its intercept has a higher Sharpe ratio than IPCA in all five universes, least among mega caps (+0.64). It changes the ruler and adds the intercept at once, so the gap is not the intercept’s value alone. QZ-IPCA, which changes only the ruler, is ahead in the broad Core universe (+0.37) and behind among mega and micro caps (−0.09 and −0.43). In Characteristic Geometry’s same-fit comparison, the intercept’s mean-return gain is statistically clear in all four universes over 1975–2024 but in none since October 2007 (Table VI, p. 33). The drawdown panel compares books of equal size, not equal risk: in Core, NA-IPCA runs at 3.1% annual volatility against 6.1% for IPCA (brief, Table 1, p. 2), so part of its shallower drawdown is lower risk.
Exhibit 2: Cost thresholds under a turnover proxy
 (opens the full-size image in a new tab)
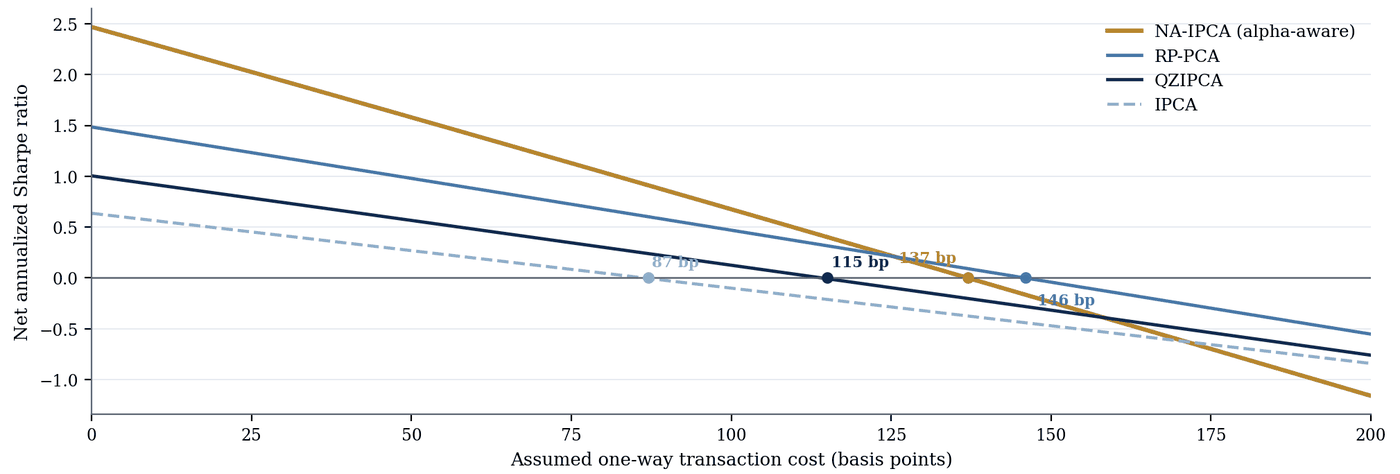
Key takeaway. Under the proxy, the average return falls to zero at a one-way charge of 87 bp (basis points; 1 bp = 0.01 percentage point) for IPCA, 115 for QZ-IPCA, 137 for NA-IPCA with the intercept and 146 for RP-PCA. The intercept rule trades more, so above roughly 130 bp RP-PCA has the highest Sharpe ratio after the proxy cost. These are sensitivity thresholds, not implementable break-even costs: on its 594-month sample, Characteristic Geometry reports about 136 bp for the complete rule and 142 for RP-PCA, and keeps the calculation only as a sensitivity check until holdings-based costs, borrowing fees and capacity are measured (p. 21; Figure IA.2, p. 54).
Exhibit 3: Checks before a backtest number is quoted
| Check | How it is done | Where | Still missing |
|---|---|---|---|
| Put every book on one size | Every model at the same total position size, long plus short: IPCA’s maximum drawdown is −34.6% per unit rather than −96.0% raw | From forecast to portfolio, Exhibit 2 | — |
| Compare at equal volatility | Each series divided by its own standard deviation | From forecast to portfolio, Exhibit 3 | Scaled by full-sample volatility, known only afterwards; no ex-ante volatility target, and drawdowns here are at equal book size |
| Split the sample | Sharpe ratios from October 2007 (206 months) reported separately: 1.12 against 2.49 over the full sample | From forecast to portfolio, Exhibit 3 | Not a holdout: the split is retrospective, and a change across periods needs a direct between-period test (Characteristic Geometry, pp. 33, 57) |
| Use one setting for every model | Risk-model ridge 0.01 for every model, ruler and date, with no model-specific tuning; the intercept cap (0.035) never binds | Characteristic Geometry, pp. 14, 17 | Not documented as fixed before results were seen (Characteristic Geometry, p. 57) |
| Declare the search | State which choices were fixed before results were seen | Characteristic Geometry, p. 57: the paired comparisons are retrospective, not predeclared tests, and not corrected for specification search; Characteristic Libraries, p. 19: the U.S. data were also used in developing the design | A design fixed in advance and tested on later data or another market |
| Price trading costs | Zero-return thresholds under a turnover proxy, 87–146 bp (a sensitivity check, not a break-even cost); stock-by-stock ledgers at 10–100 bp per dollar traded in the job market paper | This page, Exhibit 2; Characteristic Libraries | Borrow fees, market impact and capacity |
| Report intervals, not only point estimates | Paired mean-return gain from the intercept, Core stocks: 0.49 percentage points a month, 95% interval [0.35, 0.63], over June 1975–November 2024 (594 months); 0.20, [−0.07, 0.41], p = 0.11, since October 2007 (206 months) | Characteristic Geometry, Table VI, p. 33 | The brief behind Exhibits 1–2 reports none |
| State the hindsight | The characteristic library reflects today’s knowledge; point-in-time availability not verified | “Read with care” boxes | A point-in-time library |
| Separate the book from known factors | Regress each book’s returns on standard factors (Fama–French five plus momentum) and report the intercept with its interval | Not yet done in this section | The regression itself |
Every number in this table appears, with its source, on this page, on From forecast to portfolio or in the papers cited. Returns are before trading costs unless stated. Sources: From forecast to portfolio, Exhibits 2–3; this page, Exhibit 2; Characteristic Geometry, pp. 14, 17, 57 and Table VI, p. 33; Characteristic Libraries, Sections IV.A and IV.C, pp. 13–14, and p. 19.
Key takeaway. A backtest number goes on these pages only with its book size, volatility basis, sample split and cost treatment stated; the last column lists what is not yet measured, including a test fixed in advance and a factor regression.
Where this connects
- Characteristic Geometry: the intercept’s value within one fitted model, with paired inference and the post-2007 evidence.
- Interpreting Pricing Errors: what an alpha does and does not mean.
- Related projects: From forecast to portfolio (the same protocol, compared at equal position size and volatility).