Why the ruler matters
Measured · Project · research evidence · June 2026 · sources: seminar deck When Geometry Matters (24 June 2026) and report Statistical Factor Models Carry a Hidden Ruler (27 June 2026) · All projects
What I built
- Fixed-window and monthly-refit comparisons of IPCA, QZ-IPCA and NA-IPCA on 153 characteristic-managed portfolios (estimation from July 1963, evaluation March 2007 to November 2025).
- Fit and split reported separately, so a change of attribution cannot pass for a better fit.
- A recomputation that adds the intercept back from the replication records.
Why it matters on a desk Every statistical factor model used for risk or attribution has to pick a ruler; standard implementations pick the plain one by default, usually without saying so. A change of factor model can move reported factor attributions with no new information; check the split before reading an attribution change as a signal.
Skills and tools latent-factor models principal components on a 153-characteristic library out-of-sample R² decomposition replication from stored records
Read with care. These are descriptive results from a seminar deck and a short report, not from a published paper. The formal statements are in Geometric Framework and Characteristic-Space Metrics. No ruler is shown to be best.
The setting
A factor model used for risk or return attribution splits expected return between the factors and the intercept, the part that no factor in this model explains. To make that split, the model needs a ruler. Weighting the characteristics and adding them up gives every stock a score; such a weighted sum is a direction (not a portfolio). The ruler measures how large a direction is and how much two directions overlap. The plain ruler (the Euclidean or identity metric) judges a direction by its weights alone. The characteristic ruler (the Gram metric) judges it by the scores it gives real stocks. Standard implementations use the plain ruler without saying so. On 153 U.S. characteristics, switching rulers leaves the fit alone and moves the split, so a change of risk or attribution model can move reported factor attributions without any new information.
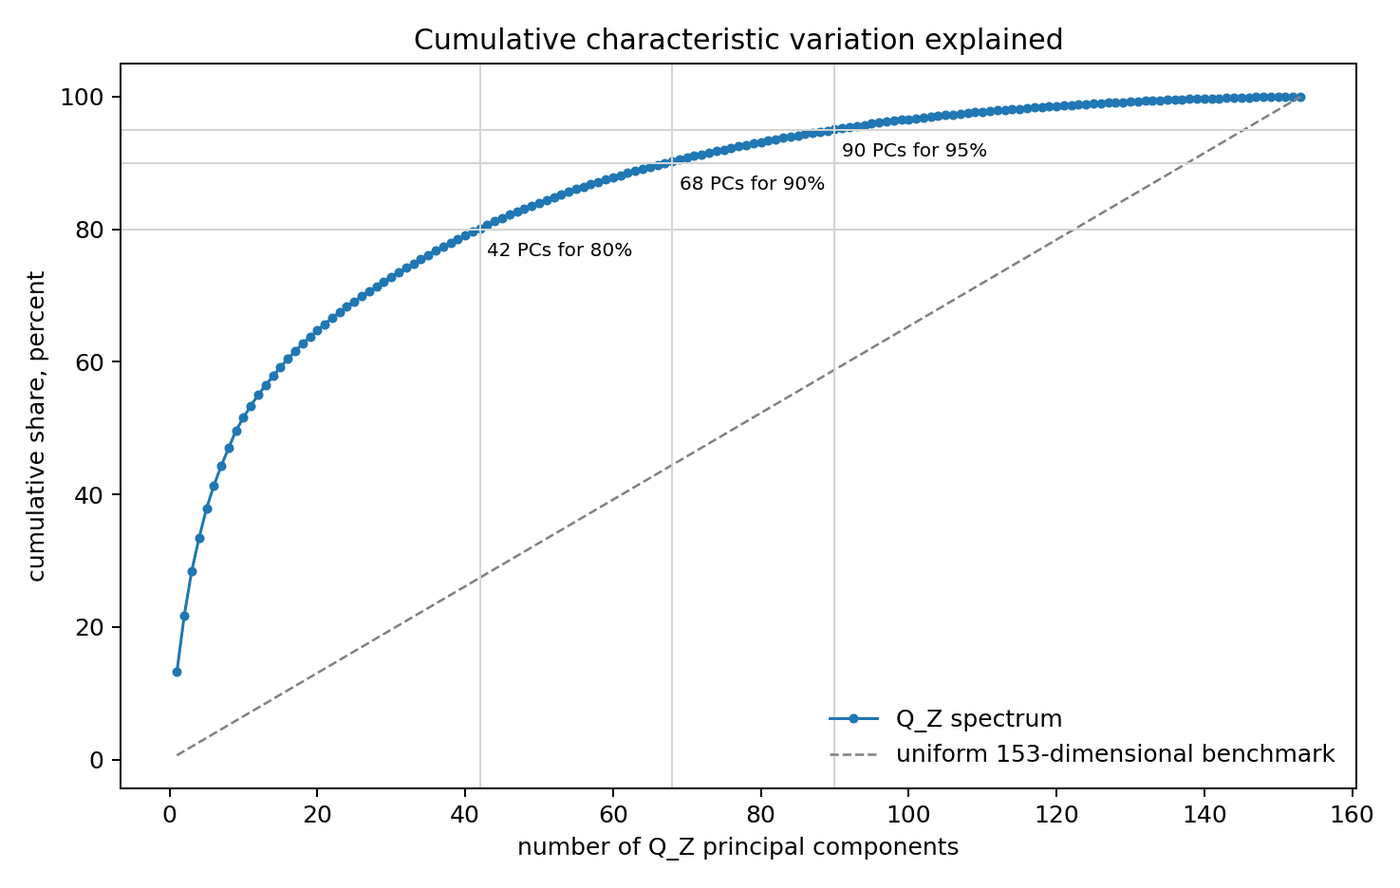
Exhibit 1: 153 characteristics, far fewer directions
 (opens the full-size image in a new tab)
Key takeaway. 42 directions account for about 80% of the variation and 67 to 68 for 90%, depending on the months used (report, p. 2): the library overlaps heavily, so how overlap is measured is a real modelling choice. These are directions of variation in the characteristics, not priced risks.
Exhibit 2: Same fit, different split
| Model | Ruler | XS R² | Pred. R² | TS R² | Total R² |
|---|---|---|---|---|---|
| IPCA | plain | −0.414 | −0.033 | 0.679 | 0.862 |
| QZ-IPCA | characteristic | 0.458 | 0.034 | 0.679 | 0.862 |
| NA-IPCA | characteristic, capped intercept | 0.462 | 0.035 | 0.679 | 0.862 |
Out of sample: estimated on July 1963 to February 2007, evaluated on March 2007 to November 2025; three hidden factors, 153 characteristic-managed portfolios. IPCA is instrumented principal component analysis. XS = cross-sectional; Pred. = predictive; TS = time-series. Source: report Statistical Factor Models Carry a Hidden Ruler, p. 2; dates from the seminar deck, slide 23; recomputation with the intercept from the replication records.
Key takeaway. Time-series and total R² are the same for all three models to three decimals, yet cross-sectional R² moves from −0.414 to 0.458 and predictive R² from −0.033 to 0.034. Every model also estimates an intercept, and these two columns count only the part of expected return credited to the factors. The jumps record a different split, not a better fit or forecast: with the intercept added back, IPCA and QZ-IPCA predict identically (the report reads the jump as better pricing). A fit frozen for 18 years is also a stress test, not practice.
Exhibit 3: Re-estimated every month, the gap narrows
| Model | XS R² | Pred. R² |
|---|---|---|
| IPCA | 0.523 | 0.054 |
| QZ-IPCA | 0.589 | 0.051 |
| NA-IPCA | 0.592 | 0.050 |
Each model re-estimated monthly on the previous 20 years and, unlike Exhibit 2, given six observed factors (Fama–French five plus momentum); 34,425 portfolio-months, March 2007 to November 2025. The report’s other R² columns score a one-month-ahead forecast and are not comparable with Exhibit 2. Source: report Statistical Factor Models Carry a Hidden Ruler, p. 2; window from the seminar deck, slide 31; observed factors and column definitions from the replication records.
Key takeaway. With monthly re-estimation, cross-sectional R² is 0.523 for IPCA and 0.589 to 0.592 with the characteristic ruler, a far smaller gap than in Exhibit 2, and predictive R² is slightly lower (0.051 and 0.050 against 0.054). This design changes more than the ruler: re-estimation removes most of IPCA’s fixed-window shortfall, and observed factors are added. These columns again leave out the intercept, so neither gap measures a forecasting gain or loss.
Where this connects
- Geometric Framework: which ruler, and how to build identification and a cap on the intercept on it.
- Characteristic-Space Metrics: a matched change of ruler moves the split, not the fit, and the ruler’s own estimation error belongs in the confidence intervals.
- Characteristic Geometry: what the ruler does to a portfolio.
- Related projects: Building the characteristic ruler (how the ruler is estimated) · From forecast to portfolio (what it does to a portfolio).