palette = ({
  naipca_iab: "#18557f", complete: "#18557f",
  qz_ipca: "#8a6a1a",
  ipca: "#6f9cc0", rp_pca: "#7a7a7a", ff5: "#b3b3b3",
  naipca_beta_only: "#8a8378", beta_only: "#8a8378",
  band: "rgba(0,0,0,0.06)", muted: "rgba(0,0,0,0.6)", rule: "rgba(0,0,0,0.1)"
})
LANG = (document.documentElement.lang || "en").startsWith("zh") ? "zh" : "en"
STR = ({ en: { view: "View", cost: "Cost (bp per traded dollar)", universe: "Universe", sample: "Sample (months)", log: "Log scale", models: "Models", statistic: "Statistic", theme: "Theme", sort: "Sort by", method: "Method", scenario: "Scenario", block: "Block (months)", metric: "Metric", intervals: "Intervals", cost_bp: "One-way cost (bp)", failed: "Interactive data failed to load. The static figure is shown instead." },
        zh: { view: "视图", cost: "成本(每交易一美元,基点)", universe: "股票池", sample: "样本(月)", log: "对数坐标", models: "模型", statistic: "统计量", theme: "主题", sort: "排序", method: "方法", scenario: "情景", block: "块长(月)", metric: "指标", intervals: "区间", cost_bp: "单边成本(基点)", failed: "交互数据加载失败,改为显示静态图。" } })
t = (k) => STR[LANG][k] ?? STR.en[k] ?? k
fmt2 = (x) => (x == null || Number.isNaN(x)) ? "n/a" : x.toFixed(2)
fmt1 = (x) => (x == null || Number.isNaN(x)) ? "n/a" : x.toFixed(1)
fmtBp = (x) => (x == null || Number.isNaN(x)) ? "> 500" : `${Math.round(x)} bp`
parseMonth = (s) => new Date(`${s}-01T00:00:00Z`)
// Sharpe, annualised, sample std (ddof = 1): matches the release convention
sharpe = (r) => {
  const n = r.length, m = r.reduce((a, b) => a + b, 0) / n
  const v = r.reduce((a, b) => a + (b - m) ** 2, 0) / (n - 1)
  const vol = Math.sqrt(v) * Math.sqrt(12)
  return vol > 1e-12 ? (m * 12) / vol : NaN
}
netSeries = (r, to, bp) => r.map((x, i) => x - to[i] * bp / 1e4)
wealthPath = (r) => { let w = 1; return r.map((x) => (w *= 1 + x)) }
nberMarks = (nber) => Plot.rectX(nber, { x1: (d) => parseMonth(d.start), x2: (d) => parseMonth(d.end), fill: palette.band })Same Forecasts, Different Portfolios: Factor Normalization and Regularization
Why two versions of one factor model with the same forecasts can hold different portfolios when a penalty on factor exposures is written in each version’s own units, and what using the model’s estimated intercept adds.
Working paper, October 2026 · 116 pages: a 46-page main text and a 70-page Internet Appendix (cited as pages IA-1 to IA-70) · not yet posted to SSRN, no DOI · page numbers refer to the paper above
Two versions of one factor model can forecast the same stock returns and still hold different portfolios. The portfolio rule adds a small constant (a ridge; the paper calls it the factor penalty) to each factor’s variance. That constant penalises how much the portfolio bets on each factor, in the units each version happens to use, so one number is two different penalties (eq. 6, p. 11). Over 594 months, the two versions’ stock forecasts differ by a median of 4.8 parts in a million (Table II, p. 24). Yet at the same penalty number their Sharpe ratios (average excess return per unit of volatility) before trading costs are 0.69 and 1.07 (Table I, p. 19). Written in one set of units, the penalty gives one portfolio; without it, both versions are at 1.62.
A portfolio needs a return forecast as well as a risk penalty, and the second result turns to the forecast. The same kind of model can also estimate an intercept, the part of expected return that none of its factors explains. Using the full fitted mean, intercept included, gives a Sharpe ratio of 2.51 before trading costs that barely moves with the penalty. Its gain over the best portfolio without an intercept is 0.89, with a 95% interval of [0.59, 1.26], and 0.57 [0.29, 0.89] net of 25 basis points per dollar traded (Table III, p. 30). Since October 2007 the net advantage has an interval that includes zero (pp. 7, 39).
1 The question
In the agenda, this paper asks: same forecast, different portfolio? Interpreting Pricing Errors asks what a model’s alpha means; this paper moves from reading the model to acting on it. The Ruler Matters then holds the target fixed and asks: same target, different stocks?
If two versions of one factor model make the same forecasts but measure factor exposure with different rulers, do they tell the investor to hold the same stocks? And what does using the intercept the model already estimates add?
To say how much of a stock’s expected return each driver explains, a model must first decide when two combinations of characteristics are really different, and how large each one is. The rule it uses for that is the ruler: technically, a metric (an inner product) on characteristic space. Give each characteristic a weight and add them up: every stock gets a score. Such a weighted combination is called a direction (it is not a portfolio). The plain ruler (the Euclidean or identity metric) judges a direction by its weights alone. The characteristic ruler (the Gram metric, built from the Gram matrix of the characteristics: their average products across stocks) judges it by the scores it gives real stocks: how large they typically are, and whether two directions’ scores line up across stocks, high on the same stocks and low on the same stocks. So the ruler is the convention a model uses to measure how large a direction is and how much two directions overlap. Two value signals that pick out the same cheap stocks count as overlapping under the characteristic ruler but as unrelated under the plain ruler.
The paper compares two separately estimated versions of one factor model that differ only in the ruler. IPCA (instrumented principal component analysis) is a standard conditional factor model in which characteristics determine each stock’s factor loadings, that is, how strongly the stock moves with the common drivers (Kelly et al. 2019). Its hidden (latent) factors have no units of their own, so a model must fix them; the paper calls this choice the normalisation. Fixing them with the plain ruler gives the Euclidean normalisation, IPCA’s usual restriction; fixing them with the characteristic ruler, the metric of Characteristic-Space Metrics (Liu 2026b), gives the Gram normalisation (eqs. 2–3 and footnote 3, p. 10). A third fit adds an intercept: the part of expected return that no factor in this model explains (the home page’s “alpha” is a close relative, measured against a stated benchmark model). It is the NA-IPCA (No-Arbitrage IPCA) of Geometric Framework (Liu 2026a), whose “no-arbitrage” is a cap on how much the intercept may carry; the cap never binds in this paper (footnote 3, p. 10).
2 Why it matters
Factor models are compared by the Sharpe ratios of their portfolios, but a portfolio is a forecast passed through a risk matrix, and that matrix carries settings written in the model’s own units. If a setting moves holdings, a manager who switches or re-estimates a risk model may read the new positions as a new signal when nothing in the forecast has changed.
- Economic. The same penalty number decides a comparison across model families. At the reference penalty, risk-premium PCA (RP-PCA, a competing way of extracting factors) has a Sharpe ratio before trading costs of 1.49 against 0.69 for IPCA with the plain ruler. Without the penalty, the gap of 0.80 becomes −0.08, with an interval of [−0.44, 0.26] (Table I, p. 19; Table II, p. 24).
- Practical. A constant added to factor variances for numerical stability is a penalty on factor exposures. Written in one set of units, or directly on stock positions, it cannot move the portfolio when the normalisation changes (Proposition 1, p. 12). The paper’s design rule: state the penalty, the units it is written in, and which part of the fitted mean the portfolio uses (p. 43).
- Statistical. The reference penalty is about 11 times the median factor variance in plain-ruler units and 27 times in characteristic-ruler units. The factor covariances are invertible without it (smallest eigenvalue 3.1 × 10⁻⁵), so it is not needed for that purpose (Internet Appendix IA.E.2, p. IA-22).
3 The argument at a glance
- Question. Investors hold portfolios, not forecasts, so a fair comparison follows the forecast to the holdings. → The question
- Framework. A hidden factor’s units are a convention: doubling a factor and halving its loadings leaves every fitted return unchanged (p. 11). The two separately estimated versions forecast alike, a median gap of 4.8 parts in a million. → The framework
- Mechanism. The rule’s constant on factor variances penalises factor exposures in each version’s own units, so the same number holds back different stock positions. → A simple example
- Evidence. At the reference penalty the two versions hold different stocks, with Sharpe ratios of 0.69 and 1.07 before trading costs. → Figure 2
- Remedy. Written in one set of units, the penalty gives one portfolio (one minus weight similarity 1.0 × 10⁻¹¹ in the median month); without it, both versions are at 1.62 before trading costs. → Table 1
- Second result. Within one fit, using the full fitted mean, intercept included, gives a Sharpe ratio of 2.51 before trading costs, flat along the penalty and 0.89 above the best portfolio without an intercept. → Figure 3
- Boundary. State the penalty, its units and the mean input. The limits: returns are before trading costs unless stated, costs are proportional, the intercept is not shown to be mispricing, the net advantage after 2007 is not resolved, and no ruler or penalty strength is shown to be best. → Scope
4 The framework
The portfolio rule holds more of a factor when its forecast is high relative to its estimated risk. Before inverting the factor risk, it adds a small constant (0.01, a ridge; the paper calls it the factor penalty) to each factor’s variance, which makes the rule hold a little less of every factor. That constant charges the portfolio’s exposure to each factor in the units in which the factor loadings are reported, so changing the ruler changes how strongly each stock position is held back (eq. 6, p. 11).
Changing the ruler is a matched change of units: every fitted return and residual stays the same, the loadings are rescaled, and overlap moves among the hidden factors, the observed Fama–French factors and the intercept (Proposition 1, p. 12). Of the portfolio rule’s inputs, only the penalty changes: doubling a factor and halving its loadings turns the same penalty into a quarter of itself on that factor (pp. 11, 13). Proposition 1 gives the map between the two versions and shows that their penalised portfolios coincide if and only if the penalty is written in one set of units: chosen under one ruler and carried to the other, or set directly on stock positions. Neither choice says what the penalty should be, because the fit is the same under every normalisation and cannot select it (Proposition 1, p. 12; p. 13).
The intercept enters through the expected-return input. The penalty acts on a portfolio only through its factor exposures. A portfolio built from the factor means alone carries its whole forecast through those exposures; adding the intercept adds positions whose expected return the factor block does not carry, so the penalty barely reaches them (Lemma 1, pp. 14–15).
Note: this paper’s characteristic ruler, month by month. The characteristic ruler used here is an exponentially weighted moving average (EWMA) of each window’s Gram matrices, with a half-life of 60 months (p. 17). It is re-estimated in each of the paper’s 618 formation months. The main text uses the 594 months from June 1975. Its participation dimension (how many equally large directions of variation the characteristics behave like) runs from 17.36 to 22.63. Its median is 19.83. The largest direction’s share of the spread (the leading eigenvalue’s share of the trace) runs from 11.76% to 15.21%. Both ranges are reported in Table IA.L.1 (p. IA-62). Neither statistic counts priced risks, and the ruler affects portfolios only through the factor penalty (p. IA-61). Data: rolling_geometry.csv from the paper’s research files (not public). The home page’s Figure 1 is a separate, descriptive exhibit on the 153-characteristic library and is not drawn from this paper. Files and pipeline: Data & Code.
Technical details
The model writes stock i’s next-month excess return as (eq. 1, p. 9)
r_{i,s+1} = z_{i,s}'\Gamma_\beta f_{s+1} + z_{i,s}'\Gamma_\delta g_{s+1} + z_{i,s}'\Gamma_\alpha + \varepsilon_{i,s+1}.
Here z_{i,s} lists the 132 characteristics, f the three hidden factors and g the five Fama–French factors; each \Gamma turns characteristics into loadings, and IPCA sets \Gamma_\alpha = 0. A normalisation with metric Q imposes \Gamma_\beta' Q \Gamma_\beta = I_K and \Gamma_\beta' Q [\Gamma_\delta, \Gamma_\alpha] = 0: the plain ruler sets Q = I_L, the characteristic ruler an average of the window’s Gram matrices W_s = Z_s'Z_s/N_s (eqs. 2–3, p. 10). The intercept fit also bounds the average squared stock-level intercept by 0.035; the bound is slack at every date, with a largest value of 1.5 × 10⁻⁴ across the 618 rolling fits (footnote 3, p. 10).
With B_t the stocks’ factor exposures, \hat\mu_t the forecast and A_{0,t} the risk matrix without the factor penalty (it keeps a position penalty \lambda_\Sigma = 0.01 written directly on stock positions), the portfolio solves (eq. 6, p. 11)
\max_w \; w'\hat\mu_t \;-\; \tfrac12\, w'A_{0,t}\, w \;-\; \tfrac{\lambda}{2}\,\lVert B_t'w\rVert^2 .
A change of normalisation maps B \to BJ^{-1}. Adjustments R and R^Q added to the two factor covariances give the same stock risk matrix, and the same portfolio for every expected-return vector, if and only if R^Q = JRJ'; for R = R^Q = \lambda I with \lambda > 0 this holds if and only if J is orthogonal, which the map from the plain to the characteristic ruler is only when the two metrics already agree on the hidden loadings (Proposition 1, p. 12; p. 13). For any expected-return vector, the penalty shrinks the portfolio’s factor exposures as B'w_\lambda = (I+\lambda M)^{-1}B'w_0 with M = B'A_0^{-1}B, and without the penalty the intercept portfolio is the same under every normalisation (Lemma 1, pp. 14–15).
5 A simple example
Try this. Here k sets the unit of the ruler: k = 2 doubles the factor and halves its stock loadings, which leaves the forecast unchanged (pp. 11, 13). (1) At k = 1 the portfolio is 50/50. (2) Drag k to 2. Rows 1 and 2 of the table do not move; only row 3, the ridge charge, falls from 0.0100 to 0.0025, because the loading is halved and the charge depends on its square. Stock 1’s share rises to 54%. (3) Drag k to 0.25. The charge grows sixteen-fold and stock 1 falls to 20%. (4) Choose “Convert the ridge with the units” (the paper calls this writing the penalty in one set of units): the dot moves to the dashed line, flat at 50% for every k. “Remove the factor ridge” also gives 50% here. What to notice: nothing about the stocks changed, only the units in which a fixed constant was charged. The toy has two independent factors; in the paper’s two-factor example the penalty tilts the portfolio toward the factor whose variance is larger in the units in which the penalty is written (p. 13).
Figure 1: Same forecast, same risk, different ridge charge. Two stocks; the units of factor 1 change and nothing else does.
How to read it. Stock 1 loads on factor 1 (mean 0.01, variance 0.02, loading 1); stock 2 loads on an independent factor whose units never change. Each stock has residual variance 0.01 plus its own penalty of 0.01 on stock positions. Converting the ridge with the units is the paper’s remedy, which it calls writing the penalty in one set of units; removing the penalty is the paper’s other benchmark (Proposition 1, p. 12; Table IA.A.1, p. IA-4). Source: illustrative arithmetic on the portfolio rule in the paper (eq. 6, p. 11); no data files.
Two cooks follow the same recipe. One measures flour in cups, the other in half-cups. The recipe also says “add a pinch of salt per unit of flour”, so the half-cup cook adds more salt, although the flour is the same. The difference lies in how the rule is written, not in the ingredients. There are two fixes: drop the rule, or convert it with the units. In the paper, the flour is the forecast, the unit is set by the ruler, and the pinch is the penalty of 0.01 added to each factor’s variance. Unlike salt, the penalty is a charge that makes the rule hold less of each factor; it grows with the square of the exposure, and a real change of ruler also mixes exposures.
6 Design and main results
The data are monthly U.S. stock returns and 132 characteristics from Jensen et al. (2023), for mega-, large- and small-capitalisation stocks (microcaps excluded), ranked each month (Section III.A, p. 16). Each month every model is refitted on the previous 120 months and its portfolio is held for one month, over 594 formation months from June 1975 to November 2024 (pp. 16–17). Each IPCA fit has three hidden factors and the five Fama–French factors as observed factors (Fama and French 2015). One mean–variance rule sets every model’s weights on individual stocks, and positions are scaled each month to a total size of one, long plus short; the paper calls this unit gross exposure (pp. 17–18). The factor penalty takes six values from 0 to 0.1, with 0.01 as the reference (p. 17). Intervals are pointwise 95% intervals from a paired moving-block bootstrap with 12-month blocks and 10,000 draws that holds the fitted models fixed (Section III.D, p. 20). Sharpe ratios are annualised and before trading costs unless stated. Costs are quoted in basis points (bp; 1 bp = 0.01 percentage point) per dollar traded.
1. Same forecasts, different holdings. If the units did not matter, the two versions would hold the same stocks. They do not: at the reference penalty, written in each version’s own units, one minus the similarity of their weights has a median of 0.17, and the typical distance between their weights is more than half of the total position (p. 21; Table II, p. 24).
Table 1: Forecasts agree; holdings agree only when the penalty is written in one set of units. The two versions of IPCA, plain and characteristic ruler, 594 months.
| Comparison | One minus weight similarity, median (maximum) | Distance between the two, median (maximum) |
|---|---|---|
| Stock forecasts (relative gap) | — | 4.8 × 10⁻⁶ (1.4 × 10⁻⁴) |
| Reference penalty, each version’s own units | 0.17 (0.55) | 0.58 (1.04) |
| Characteristic-ruler fit, penalty written in plain-ruler units | 1.0 × 10⁻¹¹ (1.4 × 10⁻⁹) | 4.5 × 10⁻⁶ (5.2 × 10⁻⁵) |
| Plain-ruler fit, penalty written in characteristic-ruler units | 4.8 × 10⁻¹² (2.6 × 10⁻⁹) | 3.1 × 10⁻⁶ (6.9 × 10⁻⁵) |
| Both without the penalty | 6.2 × 10⁻¹² (4.6 × 10⁻⁹) | 3.5 × 10⁻⁶ (9.4 × 10⁻⁵) |
Weight similarity is the cosine of the two weight vectors: 1 minus it is 0 for identical proportions. The distance is the sum of absolute differences between the two portfolios’ weights, each scaled to a total position of one, so it runs from 0 to 2. The forecast gap is the size of the forecast difference relative to the plain-ruler forecast (Table II, Panel A, p. 24).
The two versions are estimated separately, so this agreement is measured, not built in. Written in one set of units, the reference penalty gives one portfolio, and the returns follow the weights: the characteristic-ruler fit with its penalty written in plain-ruler units has the plain-ruler fit’s Sharpe ratio, 0.69 (p. 22; Table I, p. 19). The holdings gap therefore comes from writing the penalty in two sets of units.
2. The penalty along its scale, and across model families. Figure 2 moves the penalty from 0 to ten times the reference value.
Figure 2: One model, two rulers, one penalty number. Sharpe ratio before trading costs along the factor penalty, 594 months, June 1975 to November 2024 (Figures 1 and 3, pp. 4, 26).
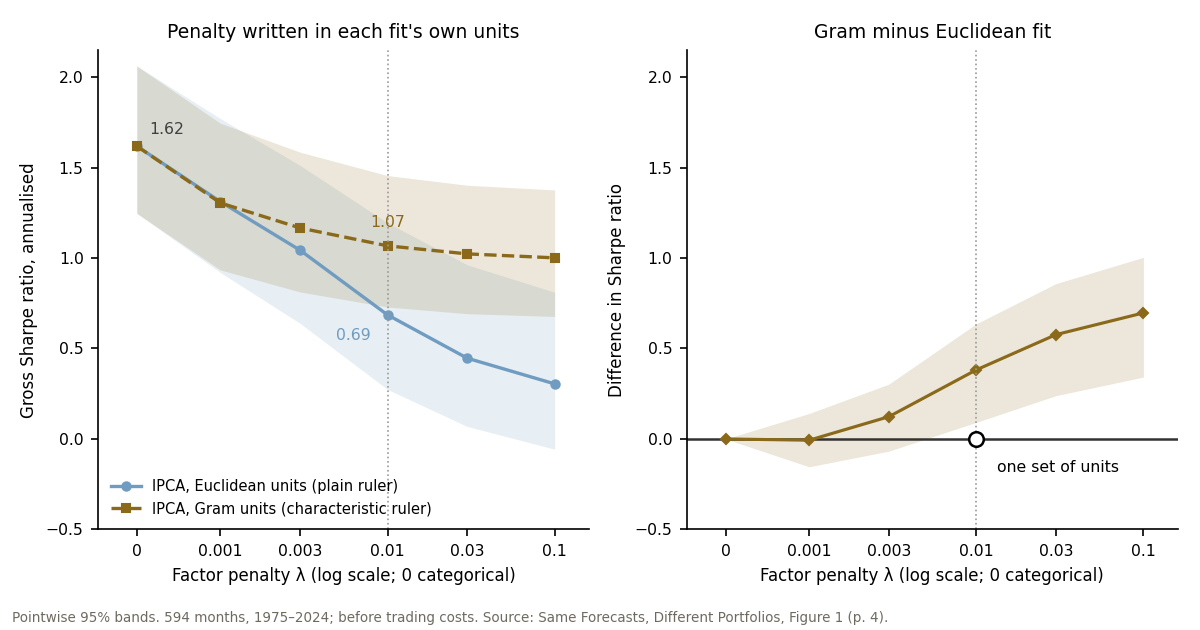
How to read it. Each line is one portfolio’s Sharpe ratio at six values of the factor penalty λ; the leftmost tick, λ = 0, is drawn apart on the log axis, and the dotted line marks the reference penalty, 0.01. Bands are pointwise 95% intervals that hold the fitted models fixed; the block menu changes only the bands, and the readout quotes the paper’s 12-month intervals. “One set of units” draws the single portfolio both rulers hold when the penalty is written in plain-ruler units; the paper computes it at λ = 0 and at the reference penalty (circled), and Proposition 1 gives the other points (†). RP-PCA and FF5 (the five Fama–French factors with loadings instrumented by the characteristics) are re-solved under the same rule (Table I, p. 19; Section IV.D, p. 25). Source: Same Forecasts, Different Portfolios, working paper (October 2026), Figure 1 (p. 4), Figure 3 (p. 26) and Tables I–II (pp. 19, 24); replication files
10_sharpe_by_lambda_594.csv, 10_contrasts_594.csv, 13_ladder_594.csv, 13_holdings_594.json. Data · PNG
What this shows. The scale of the penalty moves the Sharpe ratio by more than its units do: both versions fall from 1.62 without the penalty, the plain ruler to 0.30 and the characteristic ruler to 1.00 at λ = 0.1 (Table I, p. 19). Removing the reference penalty raises the plain ruler’s Sharpe ratio by 0.93 [0.61, 1.25] and the characteristic ruler’s by 0.55 [0.35, 0.77] (Table II, Panel C, p. 24). A ranking at one penalty number measures the penalty: RP-PCA’s lead over the plain ruler grows from −0.08 without the penalty to 1.03 at λ = 0.1, while RP-PCA’s own Sharpe ratio changes little (Table II, p. 24; p. 25). A data-driven shrinkage does not remove the dependence: Ledoit–Wolf shrinkage (Ledoit and Wolf 2004), applied in each version’s own units, gives 1.17 and 1.54 (Table II, p. 24).
3. The intercept the model already estimates. The second result holds one fit of IPCA with an intercept fixed and changes only the expected-return input: the factor means alone (the factor-mean portfolio) or the complete fitted mean, intercept included (the intercept portfolio). Both use the same risk matrix, penalty included, and no model is re-estimated (Section V.A, pp. 27–28). The benchmark that does not depend on the ruler is the best portfolio without an intercept: IPCA without the penalty, the same under both rulers, at 1.62 (pp. 14, 28).
Figure 3: One fit, two mean inputs. Sharpe ratio along the factor penalty of the intercept portfolio and the factor-mean portfolio of the same fit, 594 months (Figure 4, p. 29; Table III, p. 30).
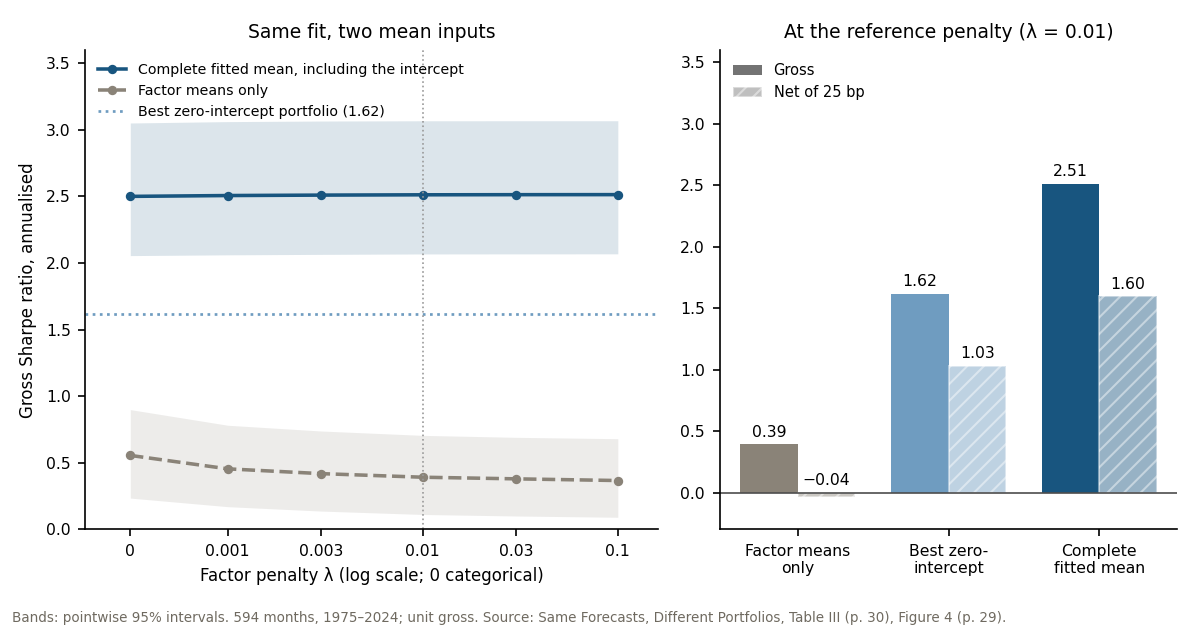
How to read it. The thick line is the selected mean input; the dashed line is the best portfolio without an intercept (IPCA without the penalty, λ = 0). Gross bands are pointwise 95% intervals from 12-month blocks. The net view charges 25 bp per dollar traded on purchases plus sales, a proportional cost that omits price impact, financing, short-sale fees and capacity, and is not an implementable net return (Table III, p. 30; footnote 23, p. 40). Source: Same Forecasts, Different Portfolios, working paper (October 2026), Table III (p. 30), Figure 4 (p. 29) and Table I (p. 19); replication files
14_table3_594.csv, 14_intercept_curve_594.csv, 15_net_by_lambda_594.csv, 15_contrasts_594.csv, 13_ladder_594.csv. Data · PNG
What this shows. The factor-mean portfolio behaves like the portfolios of Figure 2: 0.56 without the penalty, 0.39 at the reference. The intercept portfolio barely moves: 2.50 without the penalty and 2.51 at every positive value (Table III, p. 30). It exceeds the best portfolio without an intercept by 0.89 [0.59, 1.26], the smallest of its gains over the portfolios compared; net of 25 bp its Sharpe ratio is 1.60 against 1.03 (Table III, p. 30; Table I, p. 19). The gain needs the fitted intercept’s assignment to stocks: shuffling it across stocks within each month leaves a Sharpe ratio of 0.04 on average, never above 0.30 in 1,000 draws (p. 29; Table IA.M.1, p. IA-65).
4. Where the gain comes from, and how long it lasts. The gain over the best portfolio without an intercept comes mainly through lower volatility per dollar of position, not a reliably higher mean: the intercept portfolio’s annualised mean is 7.6% against 6.6%, a difference within sampling error, and its volatility 3.0% against 4.1% (pp. 33–35). Of the 0.89, 0.66 arrives through volatility and 0.23 through the mean, a descriptive split that depends on its order (footnote 21, p. 35). Regressed on that benchmark and the five Fama–French factors, the intercept portfolio loads 0.45 on the benchmark and keeps an annualised alpha of 4.9% (Table V, p. 38). Its break-even cost, at which the mean net return falls to zero, is 68 bp, equal to the benchmark’s (Table IV, p. 35). Trading one month late lowers its Sharpe ratio from 2.51 to 1.52, against 1.62 to 1.07 for the benchmark (Table III, Panel C, p. 30). Its Sharpe ratio falls from 3.95 in the first third of the sample to 1.11 in the last, a decline matched by the benchmark (p. 39). From October 2007 (206 months), its advantage over the benchmark net of 25 bp is 0.19 with an interval of [−0.41, 0.75]: the data cannot tell a gain from a loss (p. 39; Table IA.I.2, p. IA-44). Much of the gain is a short-horizon premium: setting to zero the intercept’s loadings on a group of short-horizon return and trading-activity characteristics leaves 1.81 before trading costs, and a gain of only 0.19 [−0.17, 0.53] (p. 41).
Internet Appendix comparison. Figure 4 keeps an exhibit this site built from the paper’s research release of September 2026. Its numbers belong to the Internet Appendix, and its labels predate the paper’s names: QZ-IPCA is IPCA under the characteristic ruler and NA-IPCA is IPCA with an intercept (footnote 3, p. 10); “intercept off” is the factor-mean portfolio, “mean only” the intercept portfolio, and the “complete intercept rule” the stabilised intercept portfolio, which also charges for how much the intercept loadings varied over the 24 previous estimates (p. IA-33). “Core” is the paper’s full universe: U.S. stocks excluding microcaps (p. 16).
Figure 4: Internet Appendix comparison: a holdings difference is not yet a reliable return gain. Compounded cumulative return, positions scaled to a total size of one, June 1973 to November 2024; the intercept views use 594 months from June 1975.
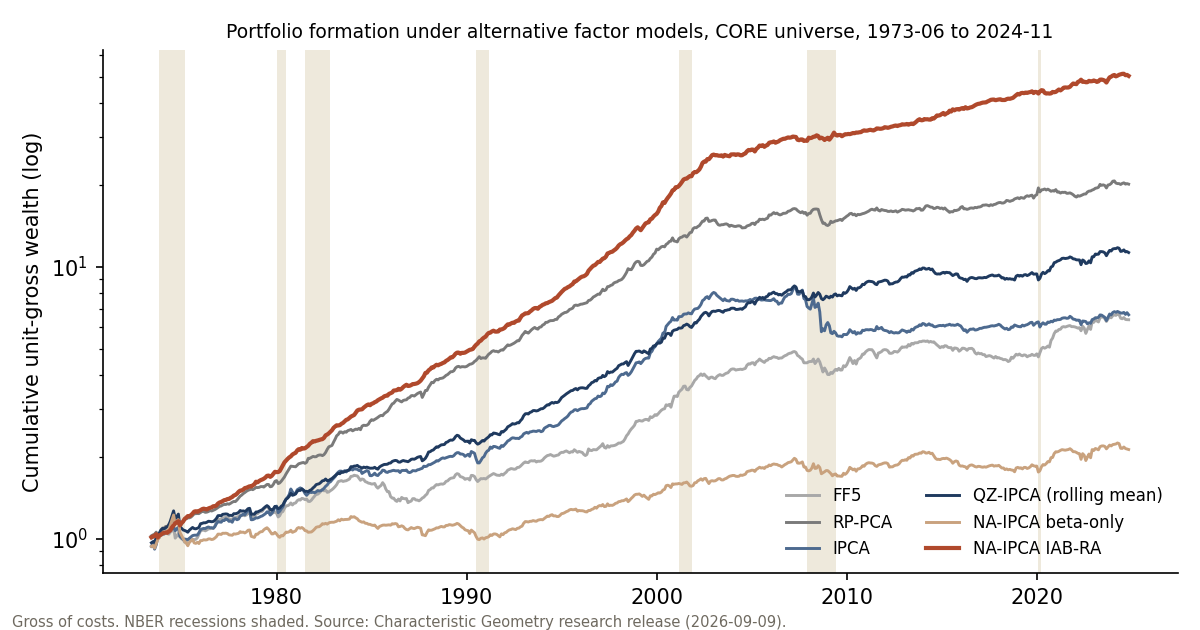
How to read it. Across models: 618 months at the reference penalty; IPCA is at 0.64, RP-PCA at 1.48 and FF5 at 0.68 (Table IA.E.3, p. IA-25), the rolling-60 version of the characteristic ruler 1.00 (Table IA.E.6, p. IA-29), the stabilised intercept portfolio 2.4926 and the factor-mean portfolio 0.32 (Table IA.G.4, p. IA-36). Intercept off vs complete intercept rule: by stock-size group over 594 months (Tables IA.I.3–IA.I.4, pp. IA-46–IA-47). One fit, three inputs: 594 months, 0.3917, 2.5126 and 2.5347, with the intercept portfolio’s monthly mean 48.69 bp [34.66, 63.36] above the factor-mean portfolio’s (Table IA.G.1, p. IA-35); the 618-month bars are in Table IA.G.4 (p. IA-36). Before trading costs by default; the 10 and 50 bp views and the break-even column charge a cost on one-way turnover computed by this site, not the paper’s cost model, and are not implementable net returns. Source: Same Forecasts, Different Portfolios, working paper (October 2026), Internet Appendix; research release 2026-09-09,
core_monthly_unitgross_returns_source.csv, core_model_performance_618.csv, iab_ra_monthly.csv, beta_only_monthly.csv, Strict24_Main_Performance.csv, Strict24_Paired_Inference.csv, ablation_summary.csv, nber_monthly.csv; release not public; paths compounded by this site, descriptive only. Data · PNG
What this shows. On all 618 months the ordering is the main text’s: the intercept portfolios first, the factor-mean portfolio last. The characteristic ruler’s lead over the plain ruler at the reference penalty is smaller there, 0.27 [−0.02, 0.58] for the EWMA version, an interval that includes zero (Table IA.E.6, p. IA-29; footnote 1, p. 4). Over the 594 months, the stabilising term adds 0.0222 [0.0100, 0.0355] to the Sharpe ratio and leaves the mean unchanged (Table IA.G.1, p. IA-35). From October 2007 (206 months), the stabilised intercept portfolio’s mean return exceeds the factor-mean portfolio’s by 0.202 percentage points a month, with an interval of [−0.071, 0.409]: the data cannot tell a gain from a loss (Table IA.I.3, p. IA-46).
7 How it relates to prior work
One literature estimates factor models from many characteristics; another regularises risk estimates for portfolio choice. This paper studies the step between, where a factor model’s forecast and risk become a portfolio.
| Prior work | What it established | What this paper adds |
|---|---|---|
| Kelly et al. (2019) | Characteristics instrument time-varying factor loadings (IPCA); a zero intercept is not rejected once several hidden factors are included | The normalisation IPCA leaves free sets the units of any factor-covariance penalty; the intercept is used as a portfolio input, a different question from their test (Section V.C, p. 31) |
| Jagannathan and Ma (2003); Ledoit and Wolf (2004); Ledoit and Wolf (2017) | Portfolio constraints and shrinkage act as covariance regularisation and can improve portfolio selection | A constant on factor variances is a stock-level penalty whose size depends on the normalisation unless it is written in one set of units; shrinkage toward the identity inherits the dependence |
| Lettau and Pelger (2020) | Risk-premium PCA extracts factors that also fit average returns | Under one rule, its 0.80 lead over plain-ruler IPCA at the reference penalty is −0.08 without the penalty: the comparison measures the penalty (Table II, p. 24) |
| Kelly et al. (2023) | Portfolios built from signals can separate alpha from factor exposure | The intercept portfolio draws most of its return from outside the factor block without an explicit hedge, and is not factor-neutral (loading 0.45; Table V, p. 38) |
A Sharpe ratio of 2.5 sits beside Kelly, Pruitt and Su’s finding that this model’s intercept cannot be distinguished from zero, and the two answer different questions. Their test asks whether the intercept loadings, one per characteristic, are jointly large; the portfolio asks whether the intercept summed across some two thousand stocks, weighted by the inverse risk matrix, has a mean per unit of risk. The second can be large when the first is not (Section V.C, p. 31).
Geometric Framework and Characteristic-Space Metrics show that the ruler decides how a fit is split without changing the fit. This paper takes its characteristic ruler from Characteristic-Space Metrics and its intercept fit, NA-IPCA, from Geometric Framework (footnote 3, p. 10), and follows a change of the ruler’s units into a portfolio: it matters only through a penalty written in those units. The Ruler Matters measures the same ruler on the stocks, and asks which familiar positions a model’s factors represent and what hedging them requires.
Interpreting Pricing Errors and Same Forecasts, Different Portfolios both ask what the model’s leftover is worth, but in different settings. The first shrinks one characteristic-based model’s alpha component (keeps an estimated fraction of it) to make forecasts more accurate under squared-error loss. The second adds the NA-IPCA intercept to expected returns inside one fitted model and measures a portfolio Sharpe ratio before trading costs. The models, objectives and samples differ, so neither result confirms or contradicts the other.
The tools are known. What is new is a check and a measurement: whether holdings move when only the units of a fixed factor penalty change, with the map that removes the dependence, and how using the full fitted mean changes a portfolio’s sensitivity to the same penalty (p. 8). It is a check, not a new estimator.
8 Scope
- Before trading costs unless stated. The net figures charge 25 bp per dollar traded on purchases plus sales, a proportional cost that omits price impact, financing, short-sale fees and capacity (footnote 23, p. 40). The results are conditional evidence on model-based allocation, not a verified implementable trading strategy: a stock enters a month only when its next-month return is recorded, and the point-in-time availability of the characteristics is not independently verified (p. 7; footnote 7, p. 16).
- Pointwise intervals. Intervals hold the rolling fits fixed and are not joint across penalties or portfolios. The 594-month sample and the plain intercept portfolio as the main-text rule were chosen after both samples and both rules were computed, and the intervals do not adjust for that (footnote 2, p. 6; footnote 12, p. 20). On all 618 months, the corresponding difference between the rulers, 0.27, has an interval that includes zero (footnote 1, p. 4; Table IA.E.6, p. IA-29).
- One model, not model families. Proposition 1 maps two normalisations of one model; it says how to carry a penalty across them, not what its strength should be, and it does not equate model families, whose forecasts differ (pp. 4, 13).
- The intercept is not shown to be mispricing. It is the part of the fitted mean that the factor block does not absorb; whether it reflects pricing errors, omitted factors or conditional dynamics is not imposed, and its alpha is a residual relative to the stated regressors (pp. 5–7; footnote 18, p. 27).
- No best ruler or penalty. The ranking of the two rulers is a function of the penalty, and the fit cannot select the penalty (pp. 13, 23). In this sample no shrinkage of the factor covariance is needed; the design rule that does not depend on the sample is to write any penalty in stock units (p. 26).
References
Fama, Eugene F., and Kenneth R. French. 2015. “A Five-Factor Asset Pricing Model.” Journal of Financial Economics 116 (1): 1–22. https://doi.org/10.1016/j.jfineco.2014.10.010.
Jagannathan, Ravi, and Tongshu Ma. 2003. “Risk Reduction in Large Portfolios: Why Imposing the Wrong Constraints Helps.” Journal of Finance 58 (4): 1651–83. https://onlinelibrary.wiley.com/doi/10.1111/1540-6261.00580.
Jensen, Theis Ingerslev, Bryan Kelly, and Lasse Heje Pedersen. 2023. “Is There a Replication Crisis in Finance?” Journal of Finance 78 (5): 2465–518. https://onlinelibrary.wiley.com/doi/full/10.1111/jofi.13249.
Kelly, Bryan T., Seth Pruitt, and Yinan Su. 2019. “Characteristics Are Covariances: A Unified Model of Risk and Return.” Journal of Financial Economics 134 (3): 501–24. https://www.sciencedirect.com/science/article/abs/pii/S0304405X19301151.
Kelly, Bryan, Semyon Malamud, and Lasse Heje Pedersen. 2023. “Principal Portfolios.” Journal of Finance 78 (1): 347–87. https://doi.org/10.1111/jofi.13199.
Ledoit, Olivier, and Michael Wolf. 2004. “A Well-Conditioned Estimator for Large-Dimensional Covariance Matrices.” Journal of Multivariate Analysis 88 (2): 365–411. https://doi.org/10.1016/S0047-259X(03)00096-4.
Ledoit, Olivier, and Michael Wolf. 2017. “Nonlinear Shrinkage of the Covariance Matrix for Portfolio Selection: Markowitz Meets Goldilocks.” Review of Financial Studies 30 (12): 4349–88. https://academic.oup.com/rfs/article-abstract/30/12/4349/3863121.
Lettau, Martin, and Markus Pelger. 2020. “Estimating Latent Asset-Pricing Factors.” Journal of Econometrics 218 (1): 1–31. https://www.sciencedirect.com/science/article/abs/pii/S0304407620300051.
Liu, Mingyang. 2026a. A Geometric Framework for Identification in Characteristic-Based Factor Models. https://doi.org/10.2139/ssrn.7013178.
Liu, Mingyang. 2026b. Characteristic-Space Metrics in Factor Models: Identification and Inference. https://doi.org/10.2139/ssrn.7445120.
Citation
BibTeX citation:
@report{liu2026forecasts,
  author = {Liu, Mingyang},
  publisher = {Imperial Business School, Imperial College London},
  title = {Same {Forecasts,} {Different} {Portfolios:} {Factor}
    {Normalization} and {Regularization}},
  date = {2026-10},
  url = {https://mingyangliu.org/research/same-forecasts-different-portfolios.html},
  langid = {en}
}
For attribution, please cite this work as:
Liu, Mingyang. 2026. Same Forecasts, Different Portfolios: Factor
Normalization and Regularization. Working paper. Imperial Business
School, Imperial College London. https://mingyangliu.org/research/same-forecasts-different-portfolios.html.