palette = ({
  naipca_iab: "#18557f", complete: "#18557f",
  qz_ipca: "#8a6a1a",
  ipca: "#6f9cc0", rp_pca: "#7a7a7a", ff5: "#b3b3b3",
  naipca_beta_only: "#8a8378", beta_only: "#8a8378",
  band: "rgba(0,0,0,0.06)", muted: "rgba(0,0,0,0.6)", rule: "rgba(0,0,0,0.1)"
})
LANG = (document.documentElement.lang || "en").startsWith("zh") ? "zh" : "en"
STR = ({ en: { view: "View", cost: "Cost (bp per traded dollar)", universe: "Universe", sample: "Sample (months)", log: "Log scale", models: "Models", statistic: "Statistic", theme: "Theme", sort: "Sort by", method: "Method", scenario: "Scenario", block: "Block (months)", metric: "Metric", intervals: "Intervals", cost_bp: "One-way cost (bp)", failed: "Interactive data failed to load. The static figure is shown instead." },
        zh: { view: "视图", cost: "成本(每交易一美元,基点)", universe: "股票池", sample: "样本(月)", log: "对数坐标", models: "模型", statistic: "统计量", theme: "主题", sort: "排序", method: "方法", scenario: "情景", block: "块长(月)", metric: "指标", intervals: "区间", cost_bp: "单边成本(基点)", failed: "交互数据加载失败,改为显示静态图。" } })
t = (k) => STR[LANG][k] ?? STR.en[k] ?? k
fmt2 = (x) => (x == null || Number.isNaN(x)) ? "n/a" : x.toFixed(2)
fmt1 = (x) => (x == null || Number.isNaN(x)) ? "n/a" : x.toFixed(1)
fmtBp = (x) => (x == null || Number.isNaN(x)) ? "> 500" : `${Math.round(x)} bp`
parseMonth = (s) => new Date(`${s}-01T00:00:00Z`)
// Sharpe, annualised, sample std (ddof = 1): matches the release convention
sharpe = (r) => {
  const n = r.length, m = r.reduce((a, b) => a + b, 0) / n
  const v = r.reduce((a, b) => a + (b - m) ** 2, 0) / (n - 1)
  const vol = Math.sqrt(v) * Math.sqrt(12)
  return vol > 1e-12 ? (m * 12) / vol : NaN
}
netSeries = (r, to, bp) => r.map((x, i) => x - to[i] * bp / 1e4)
wealthPath = (r) => { let w = 1; return r.map((x) => (w *= 1 + x)) }
nberMarks = (nber) => Plot.rectX(nber, { x1: (d) => parseMonth(d.start), x2: (d) => parseMonth(d.end), fill: palette.band })The Ruler Matters: Factor Exposures, Attribution, and Portfolio Risk
A factor model that fits stock returns better need not represent the positions an investor cares about. The stocks, trading and risk needed to keep a value, momentum or size tilt while hedging the model’s loadings depend on the characteristic library and on the ruler that measures exposure.
Job market paper Working paper, October 2026 · 133 pages including the Internet Appendix
Seminar and conference presentations: University of Cambridge, Faculty of Economics, 4 November 2026 (invited; scheduled); EPFL, Lausanne, 16 June 2026 (invited seminar; precursor presented as No-Arbitrage Factor Geometry)
A factor model that fits stock returns better need not represent the positions an investor cares about. On U.S. stocks, widening the library behind a factor model from 36 to 153 characteristics raises its fit, yet its factor loadings reproduce less of a momentum or size position. Using the model to hedge adds a second choice: the ruler that measures exposure. If the ruler did not matter, a hedge with either ruler would remove the loadings completely. Hedge a book-to-market (value) position with the plain ruler, and on average 46.10% of the hedged position, by squared stock weight, still lies on the model’s loadings; with the characteristic ruler, none does (Table IA.2, p. 63). That number measures how fully the loadings are removed, not a cut in risk.
1 The question
In the agenda, this is the last step. Same Forecasts, Different Portfolios showed that the ruler’s units can move a portfolio while forecasts barely move. This paper measures the ruler directly on the stocks, asks which familiar positions a model’s factor loadings represent, and follows the answer to the stocks, trading and risk needed to keep a value, momentum or size tilt.
Same target, different stocks? If a factor model fits returns well, does it represent the positions a value, momentum or size investor cares about? And when the investor hedges with it, does the ruler that measures exposure change which stocks must be held, how much must be traded and how much risk follows?
A factor model gives every stock a loading on each factor: how strongly the stock moves with it. In instrumented principal component analysis (IPCA), a standard factor model, characteristics decide those loadings (Kelly et al. 2019). All the stock positions the loadings can form together make up the model’s loading space. A manager who wants a value, momentum or size tilt without the model’s factor risk removes the part of the position that lies in that space. The paper asks how much of the tilt goes with it, and what it takes to put the tilt back.
The ruler. To say how much of a stock’s expected return each driver explains, a model must first decide when two combinations of characteristics are really different, and how large each one is. The rule it uses for that is the ruler. Give each characteristic a weight and add them up: every stock gets a score. Such a weighted combination is called a direction (it is not a portfolio). The plain ruler (the Euclidean or identity metric) judges a direction by its weights alone. The characteristic ruler (the Gram metric) judges it by the scores it gives real stocks: how large they typically are, and whether two directions’ scores line up across stocks. The ruler is the convention a model uses to measure how large a direction is and how much two directions overlap. Two value signals that pick out the same cheap stocks, such as book-to-market and earnings-to-price, count as overlapping under the characteristic ruler but as unrelated under the plain ruler.
In this paper the characteristic ruler is measured each month on the stocks available that month: the average product of two directions’ scores across those stocks, the cross-sectional second moment of the characteristics, Q_t (Section I.A, eq. 2, p. 3). The paper calls it the stock-exposure ruler. Two directions whose weights look unrelated can still select the same stocks (p. 3). The ruler does not change how IPCA is estimated, and it is not the covariance of stock returns (p. 3; p. 20).
The short answer. Same model, same stocks, same target, different hedge, because the plain ruler judges the loadings by their weights while the hedge holds stocks. If the ruler did not matter, both hedges would leave 0% of a position on the model’s loadings. In the paper’s data, the plain-ruler hedge of a book-to-market position leaves 46.10% on average, and the characteristic-ruler hedge leaves none (Section V.A, p. 24). Beyond this comparison, the paper has three findings. First, fit and representation can part ways: the larger library fits stock returns better, yet its loadings reproduce less of momentum and size. Second, the same fitted returns can be credited very differently to observed and hidden factors. Third, keeping a tilt while removing the loadings needs different stocks, trading and total position size, depending on the library and on how exposure is measured.
2 Why it matters
Researchers and investors judge a factor model by its fit, but they use it for other things: to say which positions it represents, to credit returns to factors, and to hedge. Each use depends on how exposure is measured, which fit alone does not settle (Section I.B, p. 5).
- Economic. A better-fitting model can represent a familiar position less fully. With a free intercept, widening the library from 36 to 153 characteristics raises the model’s total stock-return R² from 17.01% to 17.70% (Table II, p. 17). Over the portfolio sample, the share of the momentum position that the loadings reproduce falls from 82.27% to 62.33% (Section IV.A, p. 22).
- Practical. A manager who removes the model’s loadings and then restores the original tilt pays in position size. For larger-firm size with a free intercept, the restored position averages 3.27 times capital in total positions (long plus short) with 36 characteristics, and 1.92 times with 153 (Section V.B, p. 25).
- Statistical. The same fitted returns can be credited very differently. For a larger-firm size position, reallocating the exposure that observed and hidden factors share raises the observed factors’ contribution from 1.38 to 45.53 basis points (bp; 1 bp = 0.01 percentage point) a month. The total stays at 2.16 bp (Section VII.A, p. 36).
3 The argument at a glance
- Fit. A larger library fits stock returns better, but that does not show it represents familiar positions better. → Why it matters
- Ruler. Measure a direction by the stocks it selects, not by its weights; two directions with unrelated weights can still overlap across stocks. → The framework
- Representation. With 153 characteristics, the loadings reproduce less of momentum and size than with 36. → Figure 2
- Attribution. Overlapping stock exposures let the same forecast be credited to observed or hidden factors; the total does not move. → Figure 3
- Hedging. With the model fixed, the plain-ruler hedge leaves on average 46.10% of a hedged book-to-market position on the loadings (p. 24); keeping a tilt needs different positions in different libraries. → Figure 4, Table 1
- Updating. At the same tilt, the policy that measures exposure on this month’s stocks rather than March’s has lower subsequent variance in all twelve exploratory comparisons; nine of twelve simultaneous intervals exclude zero. → Figure 5
- Boundary. Shares of stock positions, not of risk or premia; comparisons of complete policies; no trading-cost ledger. → Scope
4 The framework
The model. Each stock’s next-month excess return is described by a characteristic intercept, six observed factors and three hidden factors, and characteristics set the stock’s loadings on each (Section II.B, eq. 3, p. 11). The intercept is the part of expected return that no factor in this model explains. The observed factors are the market and the Fama–French size, value, profitability and investment factors plus momentum, together FFC6 (Fama and French 1993, 2015; Carhart 1997). The hidden factors (latent factors) are common drivers the model infers from returns; they are statistical, not named economic shocks (p. 2). Hidden factors can be relabelled or mixed without changing what they explain together, so the object of study is their loading space, not any one numbered factor (p. 2).
Coverage. How much of a familiar position can the loadings reproduce? Take the position’s scores across stocks, measure their squared size with one common ruler, and ask what share of it lies in the loading space: 0% means none, 100% means all of it (eq. 10, p. 21). The paper calls this share coverage. It describes stock positions. It is not explained return variance or a risk premium, and the shares of different characteristics are not slices of one budget (p. 5; p. 22).
Two hedges. To keep a tilt without the model’s factor exposure, a manager removes the part of the position that lies in the loading space. Removed with the plain ruler (the paper’s coefficient orthogonality), the position’s characteristic weights become unrelated to the loadings’ weights. Removed with the characteristic ruler on the current stocks, the stocks actually held carry no exposure to any estimated loading, and nothing is invested net (eq. 11, p. 24). The paper calls the second a loading-neutral hedge. Full loading neutrality is a controlled benchmark, not a recommendation to hedge every statistical factor (p. 2).
Tilt and position size. A hedge can also remove part of the intended tilt (the portfolio’s exposure to the named characteristic). Restoring the original tilt then takes larger positions: the total position size (long plus short, per dollar of capital) is the tilt wanted divided by the tilt each unit of position delivers (Section V.B, pp. 24–25).
Three versions of the ruler. The model’s coefficients are re-estimated each March and held for a year. Within the year, exposure can be measured with the training-average version of the characteristic ruler (its average over the previous 240 months), the annual-origin version (March’s stocks, held until February) or the current version (this month’s stocks) (Section VI, p. 31).
For specialists
With Z_t the characteristic matrix of the n_t stocks at formation, directions a and b have stock profiles Z_t a and Z_t b, and (Z_t a)'(Z_t b)/n_t = a'Q_t b with Q_t = Z_t'Z_t/n_t; a'b = 0 need not imply a'Q_t b = 0 (eq. 2, p. 3). Coverage of direction a by loading matrix L under reference Q is
\mathcal{C}(a, L; Q) = \frac{a'QL(L'QL)^{-1}L'Qa}{a'Qa},
invariant to rotations of the hidden factors (eq. 10, p. 21; p. 3). The loading-neutral hedge, with L = [e_0, C, B] (constant, observed-factor and hidden-factor coefficients), is
\tilde w^{Q}_t = \frac{Z_t}{n_t}\left[a - L(L'Q_t L)^{-1}L'Q_t a\right],
the position closest to Z_t a/n_t with zero net stock investment and zero exposure to every column of Z_t L (eq. 11, p. 24). The total position size needed to restore the original tilt satisfies G_t = \xi^0_t/\eta_t = \ell_t/(1 - C^{\text{cash}}_t): a loading-overlap term and a residual-position-shape term (eq. 12, p. 28). With a free intercept, expanding the library changes mean log position size for larger-firm size by −0.525, with contributions of −1.093 from loading overlap and 0.567 from residual shape (p. 29). The identity accounts for positions along the selected direction; it is not the smallest position size over all feasible portfolios (p. 28). Attribution between observed and hidden factors uses A = (B'\bar QB)^{-1}B'\bar QC, C_Q = C - BA and p^Q_{t+1} = p_{t+1} + A g_{t+1}, which leave the joint model unchanged (eq. 13, p. 36).
5 A simple example
Two characteristics, book-to-market and earnings-to-price, give every stock a score. Across stocks the two scores overlap by ρ, from 0 (unrelated) towards 1 (identical). The model has a single loading, a mix of the two characteristics. The investor wants a book-to-market tilt without the model’s factor exposure, and removes the loading once with each ruler.
Try this. (1) At the start, ρ = 0.6 and the loading puts a share of 0.75 of its weight on earnings-to-price. The loading reproduces 57.6% of the book-to-market position. After the plain-ruler hedge, 26.5% of the hedged position still lies on the loading; after the characteristic-ruler hedge, 0.0%. (2) Drag ρ to 0: both hedges leave 0.0%. With no overlap, the two rulers agree. (3) Drag ρ to 0.9: the plain-ruler hedge now leaves 73.2%. (4) Keep ρ at 0.9 and move the loading’s weight on earnings-to-price down to 0.10. The loading now reproduces 99.8% of the target, and restoring the tilt after the characteristic-ruler hedge needs a position about 517 times its original size. What to notice: the plain ruler misses an overlap that lives in the stocks, not in the weights; and the more of the target the loading reproduces, the harder the tilt is to restore. At an even mix (0.50) the plain-ruler leftover happens to be zero, because the two characteristics play symmetric roles here, so the leftover does not rise steadily as you drag the mix. The toy has one loading and no individual stocks; the paper’s hedges act on about 2,250 stocks a month and remove every estimated loading plus net investment (Table I, p. 10; eq. 11, p. 24). Illustrative numbers, not the paper’s data.
Figure 1: Illustrative example, one loading and two rulers. Two overlapping characteristics; the target is book-to-market.
How to read it. Coverage is the share of the book-to-market position, by squared size under the characteristic ruler, that the loading reproduces. The two hedge bars give the share of each hedged position that still lies on the loading. The scale-up in the readout is 1 ÷ (1 − coverage): the paper’s position-size identity with its second term, the shape of the remaining stock weights, set to one (eq. 12, p. 28). Source: illustrative numbers computed in the browser from equations 2, 10 and 11 of the paper; no data file.
In the paper’s data the gap is large. In the free-intercept, 153-characteristic model, the plain-ruler hedge leaves on average 46.10% of a book-to-market position on the model’s loadings, 53.51% of a momentum position and 65.13% of a larger-firm size position; the characteristic-ruler hedge leaves 0.00% (Table IA.2, p. 63). Figure 4 below switches between the two.
6 Design and main results
The library is the Jensen–Kelly–Pedersen set (Jensen et al. 2023) of 153 U.S. stock characteristics in 11 economic groups, compared with a fixed subset of 36 drawn from it (Section II.A, p. 8; Table I, p. 10). The 36 match the size of the original IPCA set, not its variables (footnote 1, p. 4). The main models have FFC6 and three hidden factors, with the intercept either estimated freely or set to zero and the model estimated again (Section II.B, p. 11). A historical comparison covers July 1964 to May 2014 (599 months). The portfolio tests re-estimate every model each March from 2007 to 2025 on the previous 240 months, and form portfolios monthly from March 2007 to November 2025: 225 formation months, with 216 months of returns common to every model (p. 9; Table I, p. 10).
Details
Stocks are split permanently into two groups by a fixed hash of their identifier: the models are learned and the holdings formed on one group (source stocks), and the pricing and hedging tests use portfolios of the other group, the target stocks (p. 9). Each month every characteristic is ranked and centred; missing values enter as zero (p. 9). The three positions studied are book-to-market, momentum (the past eleven months, skipping the latest) and larger-firm size, which takes the larger-firm direction and is not the small-minus-big factor (p. 9; p. 22). Outcomes are the mean excess return and volatility of subsequent monthly returns in bp over 216 common months, before execution and financing costs; mean total position size per dollar of capital over 225 months; and one-way turnover in percent of capital a month over 219 months (Section II.C, pp. 12–13). Intervals come from paired twelve-month calendar blocks. Three separate families of twelve comparisons carry simultaneous 95% intervals (19,999 draws); other intervals are pointwise; all condition on the fitted models (p. 15).
1. Better fit, less representation. With a free intercept, widening the library raises total stock-return R² from 17.01% to 17.70%. The factor part’s relative pricing error (squared average errors over squared average payoffs; lower is better) rises from 76.84% to 92.08% (Table II, p. 17). With the intercept set to zero and the model estimated again, the same error falls from 7.25% to 3.55% instead (p. 16; Table II, p. 17). The larger library adds distinct directions: on average the characteristics behave like 21.08 equally large directions of variation instead of 10.22, a count of stock-exposure directions, not of priced risks (Section IV.A, p. 20).
Figure 2: How much of each familiar position the model’s loadings reproduce, 2007–2025. Coverage, %, at each March estimation date (Figure 3, p. 23).
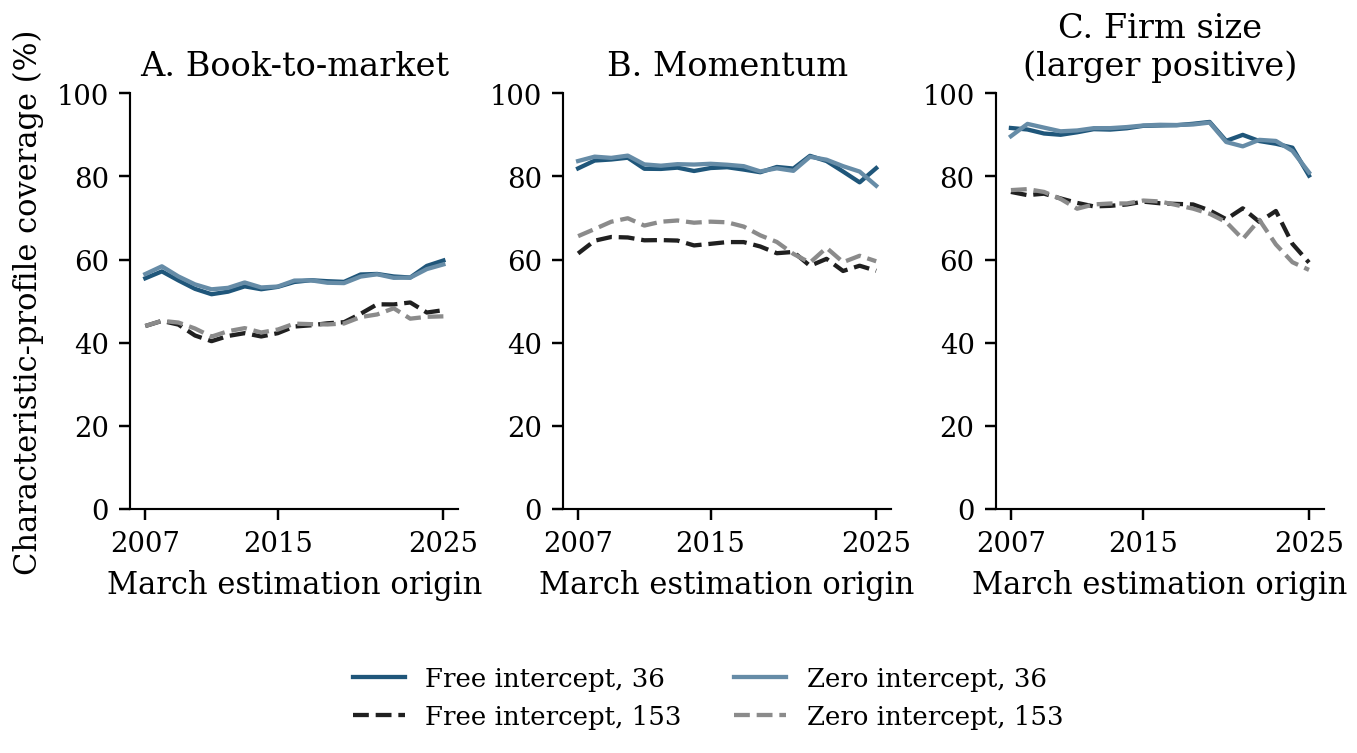
How to read it. Higher means the loadings reproduce more of the position. Each line is one model (free or zero intercept; 36 or 153 characteristics), re-estimated each March on 240 months; both libraries are measured with the same training-average version of the characteristic ruler. Size is larger-firm positive. Coverage describes stock positions, not return risk or a risk premium. Source: The Ruler Matters, working paper (October 2026), Figure 3; the paper’s figure, reproduced unchanged.
What this shows. The 153-characteristic lines sit below the 36-characteristic lines throughout. With a free intercept, average coverage of momentum falls from 82.27% to 62.33%, and of larger-firm size from 90.17% to 71.93% (p. 22). Not every group falls: intangibles and firm attributes rise from 35.62% to 37.59% (p. 22). Because each position is measured on its own, the fall is an empirical outcome, not a mechanical dilution from adding variables (p. 5; p. 8).
2. Same fit, different credit. Observed and hidden factors can load on the same stocks. With the joint model held fixed, the paper moves the shared part from one block to the other: every fitted return and the joint forecast stay the same; only the split changes (eq. 13, p. 36).
Figure 3: One forecast, three ways to credit it. Mean factor-only forecast contribution, bp a month (Figure IA.2, p. 62).
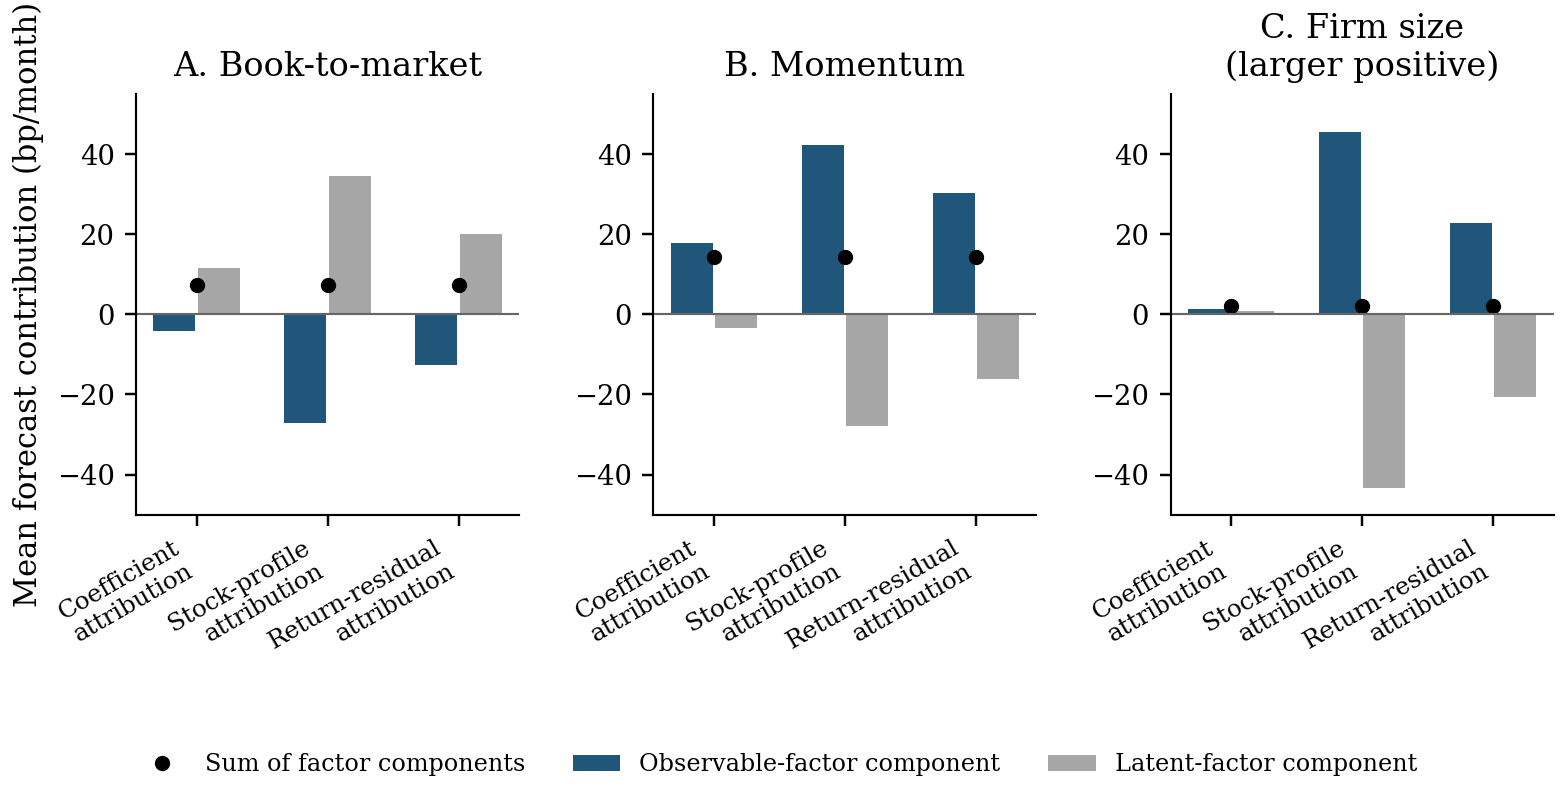
How to read it. Each panel is one test portfolio. Each group of bars is one convention for crediting the same forecast: coefficient attribution (as estimated), stock-profile attribution (shared exposure reassigned with the characteristic ruler) and return-residual attribution (shared return exposure reassigned to FFC6). Blue bars are the observed factors’ part, grey bars the hidden (latent) factors’ part, and the black dot is their sum. Free intercept, 36 characteristics, averages over 216 months. Source: The Ruler Matters, working paper (October 2026), Internet Appendix, Figure IA.2; the paper’s figure, reproduced unchanged.
What this shows. For larger-firm size, the observed factors’ contribution goes from 1.38 to 45.53 bp a month, and the hidden factors’ from 0.78 to −43.37 bp. Their sum stays at 2.16 bp (Section VII.A, p. 36). A larger reported role for familiar factors can therefore come from how shared exposure is assigned, not from more return variation explained (p. 5). The same holds between the factors and the intercept: reassigning the intercept’s overlap with the loadings gives the factor part relative pricing errors of 53.89% (36) and 72.90% (153), with every fitted return unchanged (p. 16).
3. Same model, different hedge. Hold the model fixed (free intercept, 153 characteristics) and hedge each position at a total position size of one dollar per dollar of capital, once with each ruler (Section V.A, p. 24).
Figure 4: The ruler decides whether a hedge removes the loadings. One model, two rulers, three tilts (Table IA.2, p. 63; Figure IA.3, p. 64).
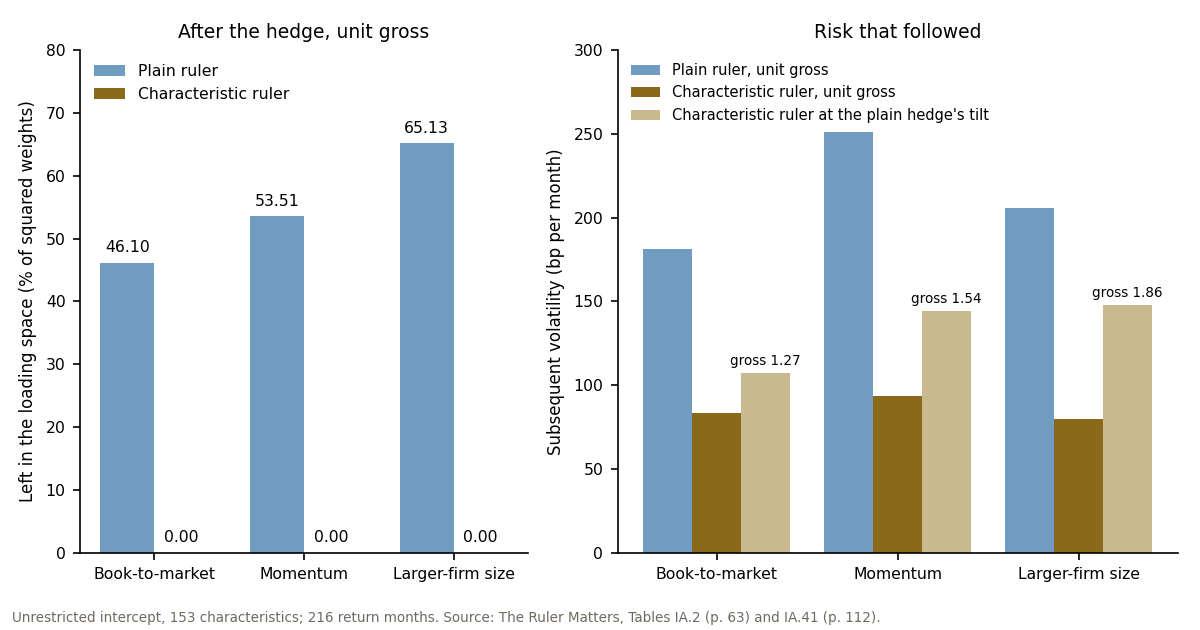
How to read it. Top: how much of the hedged position, by squared stock weight, still lies in the model’s loading space (0% = none, 100% = all), averaged over 225 formation months. Bottom: volatility of the hedged position’s subsequent monthly returns. Both hedges hold the same source stocks at a total position size of one. With the switch on, a third bar scales the characteristic-ruler holdings each month to the plain hedge’s tilt, so their position size can exceed one; the bar’s label adds that average size (Figure IA.3, p. 64; Table IA.41, p. 112). Equal position size does not hold the tilt fixed. Mean returns are before trading and financing costs. Source: The Ruler Matters, working paper (October 2026), Internet Appendix, Tables IA.2 and IA.41. Data · PNG
What this shows. With the plain ruler, 46.10% of a book-to-market hedge and 65.13% of a size hedge still lie on the model’s loadings; the characteristic ruler removes them to numerical precision (Table IA.2, p. 63). That is a difference in how neutral the stocks held are, not a 46.10% cut in variance (p. 6). The two hedges also differ in what follows. For book-to-market, subsequent volatility is 181.03 bp a month under the plain ruler and 83.09 bp under the characteristic ruler. The characteristic-ruler hedge trades more: 18.40% of capital a month, against 13.05% (Table IA.2, p. 63).
4. Keeping the tilt: libraries need different positions. Now restore each position’s original tilt every month and compare the 36- and 153-characteristic models under the loading-neutral hedge (Section V.B, pp. 24–25). With a free intercept, the larger library lowers momentum volatility from 204.26 to 151.25 bp a month, and the mean total position size from 2.34 to 1.62 times capital. For larger-firm size, volatility falls from 275.30 to 152.12 bp, and position size from 3.27 to 1.92 times capital (p. 25). These are separately fitted policies; Table 1 shows how precisely the risk differences are estimated.
Table 1: Widening the library at the same original tilt. 153 minus 36 characteristics, loading-neutral hedge (Table III, p. 27).
| Tilt | Source intercept | Volatility change, bp a month [simultaneous 95% interval] | Mean position size change, × capital |
|---|---|---|---|
| Book-to-market | Free | −2.82 [−27.67, 22.02] | −0.135 |
| Momentum | Free | −53.00 [−107.19, 1.19] | −0.718 |
| Larger-firm size | Free | −123.18 [−166.54, −79.81] | −1.349 |
| Book-to-market | Zero | −5.85 [−27.37, 15.66] | −0.144 |
| Momentum | Zero | −55.04 [−99.43, −10.65] | −0.714 |
| Larger-firm size | Zero | −120.58 [−172.92, −68.23] | −1.372 |
How to read it. Negative values mean lower subsequent risk or smaller positions with the larger library. Volatility intervals are simultaneous for the family of twelve library comparisons (19,999 paired twelve-month block draws); the position-size changes carry pointwise intervals in the paper, omitted here. Source: The Ruler Matters, working paper (October 2026), Table III.
What this shows. Only three of the twelve library comparisons have simultaneous intervals that exclude zero: larger-firm size with either intercept, and momentum with a zero intercept (p. 25). With a free intercept, momentum’s −53.00 bp has an interval of [−107.19, 1.19], so the data cannot tell whether its risk fell (p. 25; Table III, p. 27). The hedge rule matters too. For free-intercept 36-characteristic size, a historical minimum-variance hedge in the style of Daniel et al. (2020) has volatility of 185.25 bp a month, against 275.30 bp under loading neutrality. It also needs smaller positions: 1.35 times capital, against 3.27 (p. 28). An exact identity explains the position sizes: the shape of the remaining stock weights, divided by one minus the share of the position the hedge removes (eq. 12, p. 28).
5. Measuring exposure on this month’s stocks. Keep each March’s coefficients for the year, and ask whether this month’s loading correction should be measured on March’s stocks (the annual-origin version of the ruler) or on this month’s (the current version). Both policies hold the same current stocks, keep the same original tilt every month and invest nothing net; only the current version keeps the stocks held neutral to their current loadings through the year (Section VI.B, p. 32).
Figure 5: Measuring exposure on this month’s stocks or on March’s. Reduction in subsequent variance, %, with simultaneous 95% intervals (Figure 6, p. 35; Table IA.31, p. 97).
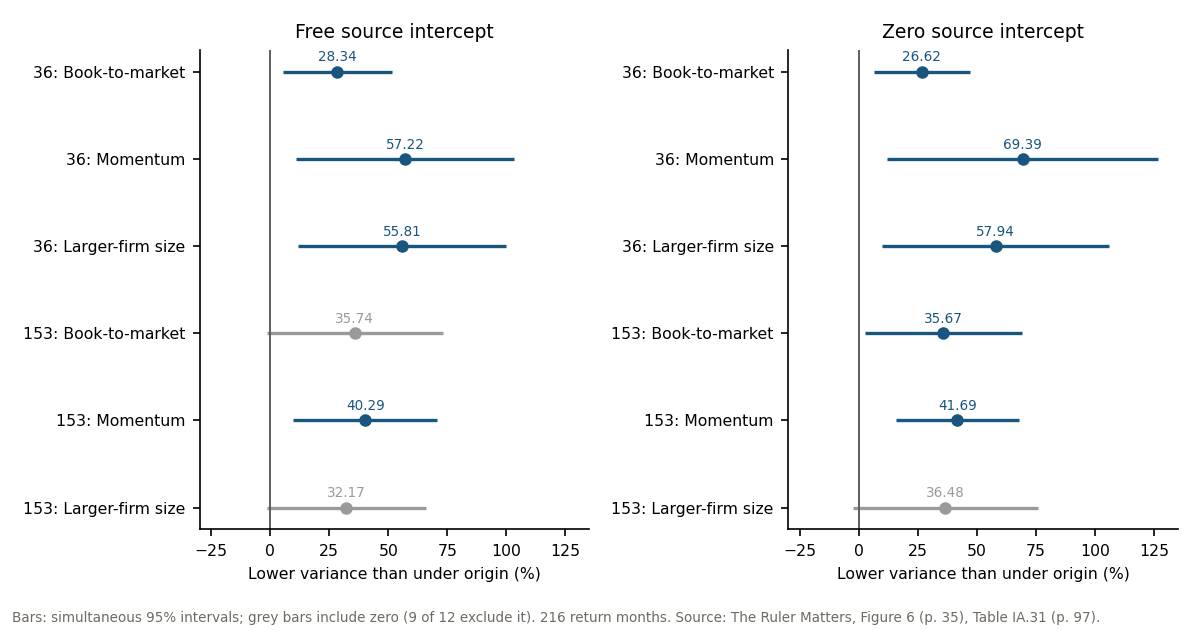
How to read it. Each row compares the two versions for one model and tilt: 100 × (1 − variance under the current version ÷ variance under the annual-origin version), so positive values mean lower subsequent variance with this month’s stocks. Bars are simultaneous 95% intervals for the family of twelve; dark bars exclude zero. Upper ends above 100% reflect the approximation, not feasible reductions (Figure 6, p. 35). The second view instead matches the signed tilt of the training-average rule, a separate family (Table IA.13, p. 78). The table below gives both versions’ levels for one model and tilt. Source: The Ruler Matters, working paper (October 2026), Figure 6 and Internet Appendix, Tables IA.13, IA.31 and IA.32. Data · PNG
What this shows. At the same original tilt, all twelve estimates favour the current version, by 26.62% to 69.39% of the annual-origin variance, and nine of the twelve simultaneous intervals exclude zero (pp. 32–34; Table IA.31, p. 97). The three that do not are free-intercept 153-characteristic book-to-market and 153-characteristic size under either intercept. Lower risk does not bring uniformly better returns or less trading: for free-intercept 36-characteristic momentum, the mean excess return moves from 25.30 to 18.30 bp a month (p. 34). This family was added as an exploratory follow-up after the training-average policies ran into non-positive wealth in an earlier test, and it compares two complete policies, not the effect of the measurement date alone (p. 6; p. 32).
6. How much of the loading to remove. A manager need not remove every loading. The paper removes 0%, 25%, 50%, 75% or 100% of the loading part of each position, as fixed policies set in advance, not fitted to returns (Section IX.A, pp. 43–44).
Figure 6: Removing more of the loading lowers risk but keeps less of the tilt. Free intercept, 153 characteristics (Table VII, p. 46).
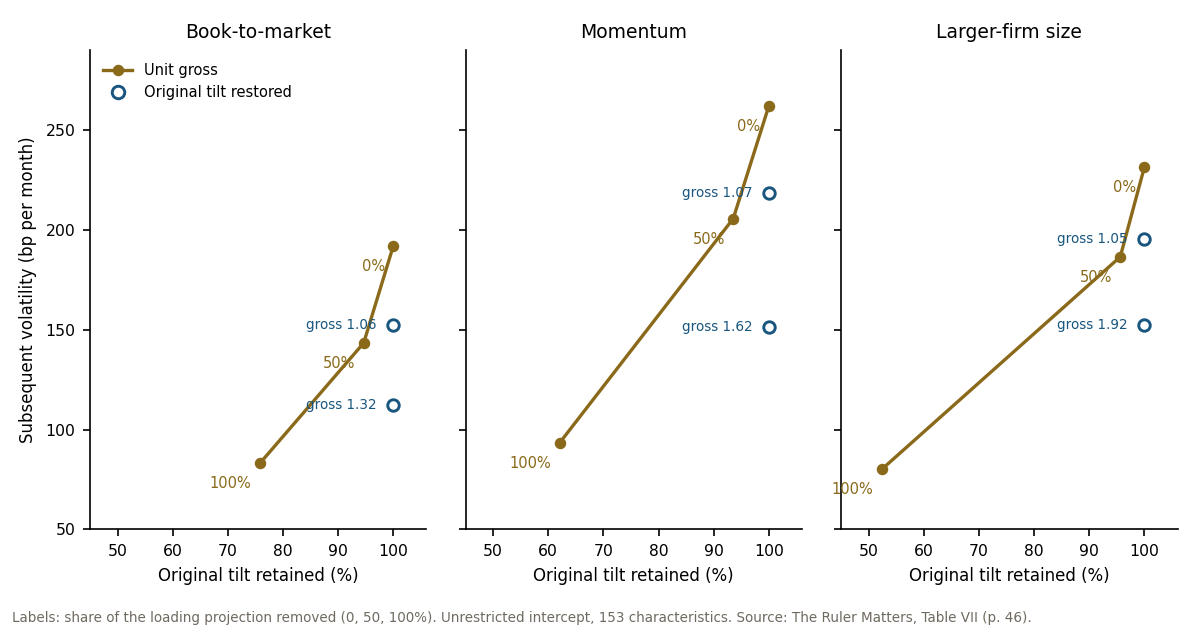
How to read it. Right keeps more of the original tilt; down is lower subsequent volatility. The solid line holds the total position size at one; the open circles restore the original tilt, labelled with the position size this needs. Point labels give the share of the loading part removed, not a cut in risk. The paper’s figure also shows 25% and 75%; those two policies are not in its tables, so the interactive has three stops (Figure 9, p. 45; p. 116). Turnover refers to the position-size-one holdings. Source: The Ruler Matters, working paper (October 2026), Table VII and Internet Appendix, Table IA.48. Data · PNG
What this shows. Hedging has two possible costs (p. 46). At a fixed position size, less of the tilt remains. Removing half of the loading part keeps 94.62% of a book-to-market tilt, and removing all of it keeps 75.80%; volatility falls from 191.98 to 143.32 bp a month at half (p. 44). At the original tilt, positions must grow: full hedging needs 1.32 times capital for book-to-market and 1.92 for larger-firm size (p. 44). The cost can become extreme. In June 2008, one zero-intercept, training-average direction delivered so little of the size tilt that restoring it would have needed positions of 8,607.78 times capital, against 3.94 under the current version on the same stocks (pp. 46–47). That figure comes from scaling one particular direction, not from minimising position size over all feasible portfolios (p. 47).
7. Pricing and hedging with the factors. Two supporting tests use the separate target stocks. On 36 common test portfolios over 216 months, FFC6 alone has a root-mean-square pricing error of 20.33 bp a month. Adding the hidden factors of the free-intercept models lowers it to 19.40 bp with 36 characteristics and 18.47 bp with 153; with a zero intercept it is 22.43 and 20.37 bp (Table V, p. 38). The interval for the free-intercept 153-minus-36 difference includes zero, and the larger library prices book-to-market less well, 30.56 against 18.36 bp (p. 38). As hedges, FFC6 alone removes 45.66% of the test portfolios’ summed variance. Adding three familiar characteristic portfolios (book-to-market, momentum and size) removes 69.42%; adding the three hidden-factor portfolios of the free-intercept models instead removes 70.70% with 36 characteristics or 67.69% with 153 (Table VI, p. 43). The hidden factors hedge substantially more than FFC6 alone, but most of that gain is also available from three familiar portfolios (p. 41).
7 How it relates to prior work
| Prior work | What it established | What this paper adds |
|---|---|---|
| Kelly et al. (2019) | IPCA: characteristics set each stock’s loadings on hidden factors; conditionally factor-neutral portfolios. | Judges the estimated loading space by the stock positions it represents under the characteristic ruler, and holds a stated tilt fixed instead of optimising residual alpha (pp. 7–8). |
| Giglio and Xiu (2021); Zhang (2024); Choi and Yuan (2026); Kozak et al. (2018) | Pricing with omitted or hidden factors; inference on pricing errors with hidden factors and characteristics; a reduced-form reading of factor models. | Measures how shared stock exposures move the reported contributions of observed factors, hidden factors and the intercept within one fit (p. 7; p. 36). |
| Daniel et al. (2020); Brandt et al. (2009) | Unpriced common variation hedged with return covariances; characteristics mapped into portfolio weights. | Compares loading neutrality with the covariance hedge at the same tilt, and gives an exact identity for the positions a loading-neutral rule needs (pp. 25, 28). |
| Jensen et al. (2023); Green et al. (2017); Feng et al. (2020) | The 153-characteristic library; which characteristics and factors carry independent information. | Treats the move from 36 to 153 characteristics as a question of which positions a fixed number of factors represents (p. 4; p. 8). |
The tools are known: IPCA, projections and covariance hedges, and factor-neutral investing itself is established (Kelly et al. 2019; Wang 2025). What is new is a common stock-level measure of which positions a model’s loadings represent, applied to separately estimated models and followed into the stocks, trading and risk of a fixed tilt (Section I.C, p. 8). The ruler matters, the paper argues, because it decides how estimated loadings are assessed across stocks, not because it changes IPCA estimation (p. 8). In short: does a better-fitting model represent the positions an investor holds? Not necessarily, and the ruler decides the hedge.
Where it fits. On this site, this is the last step of the agenda. Geometric Framework and Characteristic-Space Metrics choose the ruler and say what it decides; Interpreting Pricing Errors reads the model’s alpha with the ruler held fixed; Same Forecasts, Different Portfolios shows that the ruler’s units can move a portfolio. This paper measures the characteristic ruler on the stocks, month by month, and follows it to the positions an investor must hold.
8 Scope
- Shares of positions, not of risk. Coverage and the 46.10% loading share describe stock positions; they are not explained return variance, risk premia or cuts in variance (pp. 5–6; p. 22).
- A benchmark, not a recipe. Full loading neutrality is a controlled benchmark; it is not a recommendation to hedge every statistical factor, and it does not remove all common return risk. The ruler is not a new estimator and does not replace the return covariance (p. 2; p. 3).
- Mixed library effects. The 36- and 153-characteristic loading spaces are estimated separately and need not nest. Only three of twelve risk comparisons have simultaneous intervals excluding zero, and the position-size identity describes one direction, not the smallest feasible position (p. 6; p. 25; p. 28).
- Policies, not causes. The current-against-annual-origin results compare complete policies, not the effect of the measurement date alone; that family was specified after an earlier feasibility outcome, and mean returns and turnover do not improve uniformly (p. 6; pp. 32, 34).
- Conditional inference. All intervals condition on the fitted models and observed return paths; the three families of twelve are separate, with no joint coverage across them (p. 15; p. 105).
- No cost ledger. Mean returns are before execution and financing costs, and turnover measures how much is traded, not what trading costs (pp. 12–13). The paper finds no evidence that changes in exposure forecast next month’s hedge loss: the paired intervals include zero (Section X, p. 47). The data are U.S. stocks only.
References
Brandt, Michael W., Pedro Santa-Clara, and Rossen Valkanov. 2009. “Parametric Portfolio Policies: Exploiting Characteristics in the Cross-Section of Equity Returns.” Review of Financial Studies 22 (9): 3411–47. https://doi.org/10.1093/rfs/hhp003.
Carhart, Mark M. 1997. “On Persistence in Mutual Fund Performance.” Journal of Finance 52 (1): 57–82. https://doi.org/10.1111/j.1540-6261.1997.tb03808.x.
Choi, Jungjun, and Ming Yuan. 2026. “Inferential Theory for Pricing Errors with Latent Factors and Firm Characteristics.” Management Science, Forthcoming. https://arxiv.org/abs/2511.03076.
Daniel, Kent, Lira Mota, Simon Rottke, and Tano Santos. 2020. “The Cross-Section of Risk and Returns.” Review of Financial Studies 33 (5): 1927–79. https://doi.org/10.1093/rfs/hhaa021.
Fama, Eugene F., and Kenneth R. French. 1993. “Common Risk Factors in the Returns on Stocks and Bonds.” Journal of Financial Economics 33 (1): 3–56. https://doi.org/10.1016/0304-405X(93)90023-5.
Fama, Eugene F., and Kenneth R. French. 2015. “A Five-Factor Asset Pricing Model.” Journal of Financial Economics 116 (1): 1–22. https://doi.org/10.1016/j.jfineco.2014.10.010.
Feng, Guanhao, Stefano Giglio, and Dacheng Xiu. 2020. “Taming the Factor Zoo: A Test of New Factors.” Journal of Finance 75 (3): 1327–70. https://doi.org/10.1111/jofi.12883.
Giglio, Stefano, and Dacheng Xiu. 2021. “Asset Pricing with Omitted Factors.” Journal of Political Economy 129 (7): 1947–90. https://doi.org/10.1086/714090.
Green, Jeremiah, John R. M. Hand, and X. Frank Zhang. 2017. “The Characteristics That Provide Independent Information about Average U.S. Monthly Stock Returns.” Review of Financial Studies 30 (12): 4389–436. https://doi.org/10.1093/rfs/hhx019.
Jensen, Theis Ingerslev, Bryan Kelly, and Lasse Heje Pedersen. 2023. “Is There a Replication Crisis in Finance?” Journal of Finance 78 (5): 2465–518. https://doi.org/10.1111/jofi.13249.
Kelly, Bryan T., Seth Pruitt, and Yinan Su. 2019. “Characteristics Are Covariances: A Unified Model of Risk and Return.” Journal of Financial Economics 134 (3): 501–24. https://doi.org/10.1016/j.jfineco.2019.05.001.
Kozak, Serhiy, Stefan Nagel, and Shrihari Santosh. 2018. “Interpreting Factor Models.” Journal of Finance 73 (3): 1183–223. https://doi.org/10.1111/jofi.12612.
Wang, Rong. 2025. “Factor Investing and Factor-Neutral Investing.” Working paper. https://www.rongwang.net/files/FactorNeutralInvesting_Wang2025.pdf.
Zhang, Chu. 2024. “Testing Pricing Errors of Models with Latent Factors and Firm Characteristics as Covariances.” Management Science 70 (3): 1706–28. https://doi.org/10.1287/mnsc.2023.4768.
Reuse
Page text and interactive figures: CC BY 4.0. The manuscript is © the author and is not covered by this licence.(View License)
Citation
BibTeX citation:
@report{liu2026ruler,
  author = {Liu, Mingyang},
  publisher = {Imperial Business School, Imperial College London},
  title = {The {Ruler} {Matters:} {Factor} {Exposures,} {Attribution,}
    and {Portfolio} {Risk}},
  date = {2026-10},
  url = {https://mingyangliu.org/research/the-ruler-matters.html},
  langid = {en}
}
For attribution, please cite this work as:
Liu, Mingyang. 2026. The Ruler Matters: Factor Exposures,
Attribution, and Portfolio Risk. Working paper. Imperial Business
School, Imperial College London. https://mingyangliu.org/research/the-ruler-matters.html.