EN中文

Portrait of Mingyang Liu

Mingyang Liu

Legal name Yang Liu (刘杨). Mingyang (刘明杨) is the name I adopted on coming of age; some listings use Yang Liu.

About

I completed my PhD in Finance at Imperial College London in 2026 and am on the academic job market for the first time this year. I am now a Visiting Researcher at the Imperial Centre of Excellence in Quantitative Finance (opens in a new tab), where I continue the research programme described below.
On the 2026–27 academic job market.

My fields are empirical asset pricing, machine learning and big data in finance, and financial econometrics. My papers form one research programme on a question every characteristic-based factor model must answer before it can say anything: how to measure and compare directions in characteristic space. I call this measurement choice the ruler. It adds no information, yet it can decide which factors a model identifies, how fitted returns are split between factors and alpha, and which portfolio an investor ends up holding. The papers follow the ruler from identification and estimation to portfolio choice; A Geometric Framework develops it into No-Arbitrage IPCA (NA-IPCA), with its identification theory and inference.

Five papers, each isolating one modelling choice:

  1. Same data, different factors. Which ruler should a model use, and what does it identify? A Geometric Framework for Identification derives NA-IPCA, which nests IPCA and caps how much the intercept may carry; in calibrated simulation it recovers the latent pricing span where an intercept-free IPCA benchmark does not.
  2. Same fit, different split. Models with identical fit can credit returns differently to latent factors, observed factors and the intercept. Characteristic-Space Metrics shows that the ruler decides the split and derives inference that carries the ruler’s own estimation error.
  3. Same ruler, different target. When equal- and value-weighted fits of one model report different alphas, is it because their factors explain more, or because the expected-return estimate they must explain (the target) has changed? Interpreting Estimated Pricing Errors shows that the gap mainly reflects the target, not the factor space.
  4. Same forecast, different portfolio. Same Forecasts, Different Portfolios shows that with nearly identical forecasts, two factor normalisations give gross Sharpe ratios of 0.69 and 1.07 under the same numerical penalty, and derives the transformation that aligns the portfolios.
  5. Same target, different stocks. My job market paper, The Ruler Matters, shows that a larger characteristic library can fit returns better while representing familiar momentum and size positions less fully, and that the ruler changes the holdings and risk of portfolios with the same characteristic target.

A project in progress takes this work to corporate bonds, with Prof. Paolo Zaffaroni. Each paper stands on its own; together they show that the ruler is a modelling choice with consequences at every stage, from identification and inference to attribution and portfolio construction.

Research

Job market paper

The Ruler Matters: Factor Exposures, Attribution, and Portfolio Risk

Working paper, November 2026 · 107 pages including the Internet Appendix

Invited seminars: University of Cambridge, Faculty of Economics, 4 November 2026 (scheduled); EPFL, Lausanne, 16 June 2026 (opens in a new tab) (precursor presented as No-Arbitrage Factor Geometry)

Six-minute explainer with synthetic (AI) narration and English captions. The 2026 market episode at the start is motivation only; the paper’s sample ends in November 2025.

The question. Firm characteristics are widely used to estimate conditional factor loadings, and a larger characteristic library can fit returns better. A better fit does not show which stock positions the estimated loadings represent. That matters to researchers, who attribute returns to factors, and to investors, who use loadings to control risk. This paper measures which positions they represent.

Contributions
  1. A ruler for factor loadings. The paper compares loading directions by the stocks they select, using the cross-sectional second moment of characteristics (their Gram matrix) as the ruler. The measure is invariant to rotations of the latent factors, so it evaluates the estimated loading space itself rather than an arbitrary choice of factor coordinates.
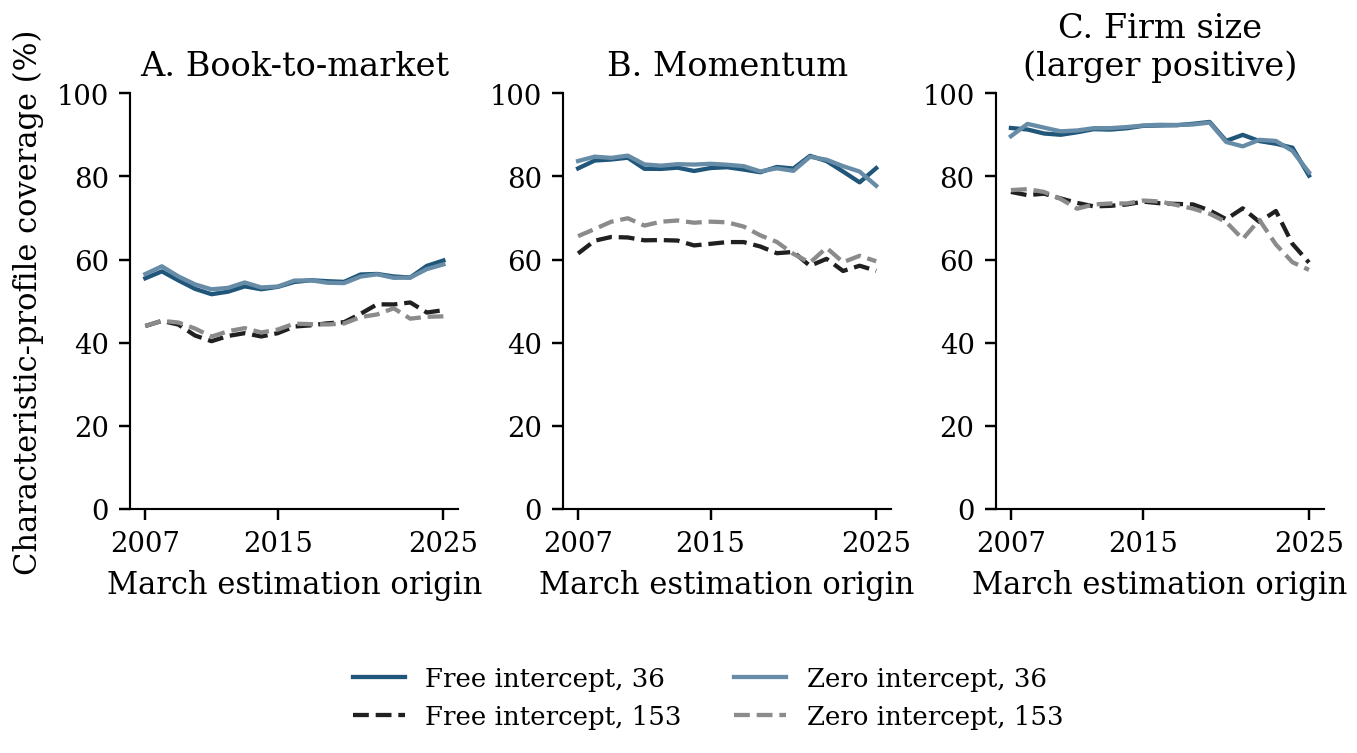
  2. Better fit, weaker representation. In U.S. equities, with the number of factors fixed, expanding an instrumented principal component analysis (IPCA) model from 36 to 153 characteristics raises in-sample fit, yet the loading space represents momentum and size positions less fully: with an unrestricted intercept, average momentum coverage falls from 82.27% to 62.33%, and larger-firm size coverage from 90.17% to 71.93%.
  3. Fit does not identify attribution. For a larger-firm size position, reallocating exposure shared by observed and latent factors raises the contribution credited to observed factors from 1.38 to 45.53 basis points a month, while their combined fitted contribution stays at 2.16 basis points.
  4. The ruler changes portfolio risk. With coefficients fixed and the same characteristic target, measuring exposure on current rather than annual-origin stocks gives 26.62% to 69.39% lower estimated subsequent return variance in all twelve exploratory positive-target comparisons; nine of the twelve simultaneous 95% intervals exclude zero.

Relative to the literature. IPCA and machine-learning models of returns (Kelly, Pruitt and Su, 2019; Gu, Kelly and Xiu, 2020) are judged mainly by fit; this paper asks what the estimated loadings represent across stocks, and shows that a decline in momentum coverage is an empirical outcome, not mechanical dilution from adding variables. Work on pricing errors with latent factors (Choi and Yuan, 2026) studies alphas; this paper measures how shared exposures move attribution within a fixed fitted return. Work on characteristic portfolios that hedge common risk (Daniel, Mota, Rottke and Santos, 2020) chooses hedges by return covariances; this paper holds the characteristic objective fixed and shows that the exposure reference decides which stocks implement it. Rather than proposing a new estimator, the paper shows that factor models should be judged by the economic exposures they represent and the portfolio decisions those exposures support, alongside return fit.

Figure 3 (p. 24), the paper’s own figure. Each model has the Fama–French five factors plus momentum and three latent factors, re-estimated each March on the previous 240 months (19 origins, 2007–2025); both libraries are measured with the same training-average characteristic ruler. Coverage is the share of a fixed stock-characteristic profile that the model’s loading space represents (100% = fully represented); it is not a share of return risk or a risk premium. · Full-size image of Figure 3 (opens in a new tab) Key takeaway. With the factor count fixed, the 153-characteristic models represent less of each familiar position than the 36-characteristic models. Under an unrestricted intercept, average coverage of the momentum profile falls from 82.27% to 62.33%, and of larger-firm size from 90.17% to 71.93% (p. 22).

Working papers

Same Forecasts, Different Portfolios: Factor Normalization and Regularization

Working paper, October 2026 · 116 pages including the Internet Appendix

Two separately estimated IPCA specifications that differ only in how the loadings are normalised (Euclidean or Gram metric) give nearly identical forecasts but gross Sharpe ratios of 0.69 and 1.07 under the same numerical penalty on factor covariances. The paper derives the penalty transformation that keeps portfolio positions unchanged across equivalent model representations; applying it aligns the two portfolios (p. 3).

Characteristic-Space Metrics in Factor Models: Identification and Inference

SSRN preprint, September 2026

Two factor models can give every stock the same fitted return yet credit it differently to latent factors, observed factors and an intercept; the paper shows that the metric (inner product) chosen for characteristic space, a measurement convention or “ruler”, decides that split, and derives confidence intervals that carry the metric’s own estimation error.

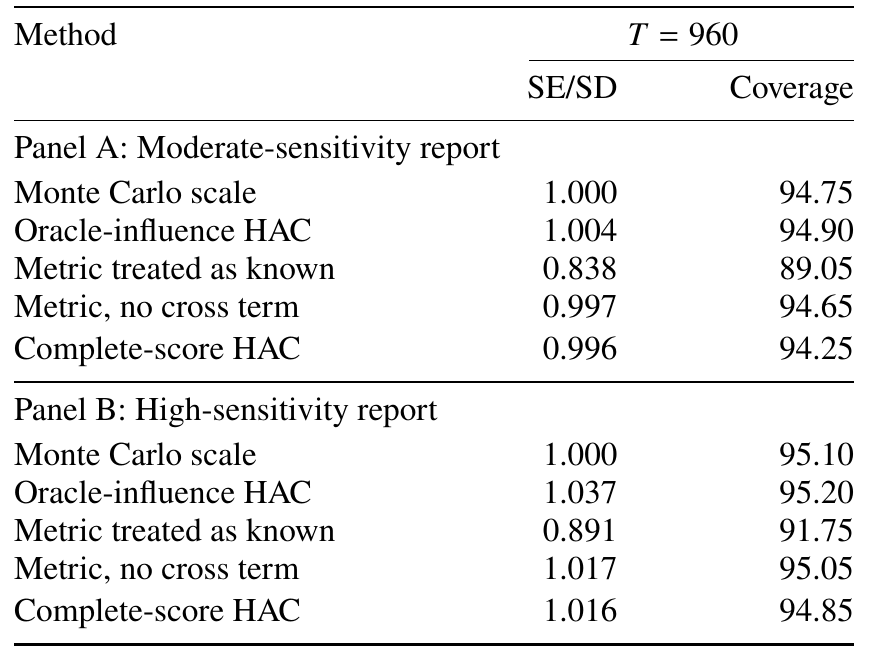
Table II (p. 34), excerpt: T = 960 months. 2,000 simulated panels with 12 characteristics and 100 stocks; nominal coverage 95%. “Metric” is the paper’s term for the ruler. · Full table, Table II with both horizons, as an image (opens in a new tab) Key takeaway. In a stylised simulation built to isolate this mechanism, treating the estimated metric (the ruler) as if it were known understates standard errors: with T = 960 months, nominal 95% confidence intervals for the two reported quantities cover the true value only 89.05% and 91.75% of the time. Carrying the metric’s own estimation error (complete-score HAC) raises coverage to 94.25% and 94.85%.

Framework paper: A Geometric Framework for Identification in Characteristic-Based Factor Models (SSRN preprint, March 2026, which derives NA-IPCA; its inference theory is developed further in this paper; PDF, SSRN)

Interpreting Estimated Pricing Errors: Evidence from Characteristic-Based Return Forecasts

Working paper, September 2026

Pairing each model’s expected-return estimate with each model’s factors on the same U.S. stocks, the paper finds that the alpha gap between equal- and value-weighted training mainly reflects different expected-return estimates, and that historical residual diagnostics add little to forecast selection (exploratory evidence).

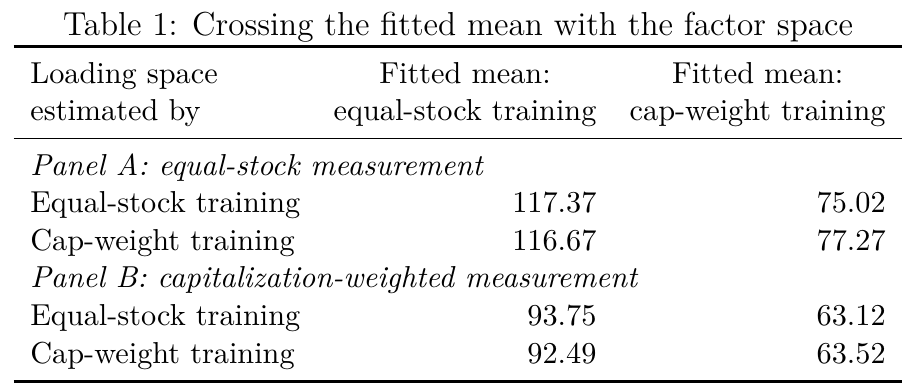
Table 1 (p. 13). Each cell: the part of the column’s fitted mean that the row’s loading space cannot represent, in basis points a month. Equal-stock training is the equal-weighted model; cap-weight training is the value-weighted model. · Full-size image of Table 1 (opens in a new tab) Key takeaway. Holding the equal-stock-trained mean fixed and swapping only the loading space barely moves the residual (Panel A: 117.37 to 116.67 bp); swapping the mean instead moves it to 75.02 bp. The alpha gap between the two models thus mainly reflects a change in the expected-return estimate being explained, not in the factor space, without showing which estimate is closer to the unknown expected return.

Research in progress

Exposure or Intercept? Identifying Corporate Bond Premia with No-Arbitrage IPCA

With Paolo Zaffaroni · In preparation

Using No-Arbitrage IPCA (NA-IPCA) on public TRACE data, the paper asks whether corporate bond characteristics predict returns through factor exposures or through an intercept the factors leave unexplained, and how much of that split depends on the choice of ruler (the metric) and on the cap on how much the intercept may carry.

Research software

NA-IPCA toolkit

The Python packages behind the rolling estimates in Same Forecasts, Different Portfolios: estimation of IPCA, QZ-IPCA and NA-IPCA with metric diagnostics, used for 618 rolling monthly estimation windows, with a run log on every fit and parity tests against a separate MATLAB reference implementation. Available to academic users on request.

Teaching and mentoring

Financial Statistics, Graduate Teaching Assistant

MSc Risk Management & Financial Engineering, Imperial Business School

Student rating 4.8 out of 5. Nominated by students for the Excellence in Teaching Award in both years. I wrote a 96-page set of teaching notes for the course (lecture summaries and worked solutions), shared for academic use.

Imperial Student Investment Fund: a student finance lab

Imperial Student Investment Fund (opens in a new tab), Imperial Business School · Adviser; former Chair of the Executive Committee and Advisory Committee

The fund works as a student finance lab: students take what they learn in class and apply it to real markets. Working with the Head of the Department of Finance, I helped develop the fund as a teaching lab and build its Python research platform, on which students work with real trade-level market data from the LSEG database.

As a mentor, I show students how to turn the theory from their courses into investment decisions. I led the fund’s student teams in the 2026 QRT Quantitative Competition, a paper-trading competition: four teams reached the final, and two placed second and third.

I have organised and coordinated the lab’s teaching activities with Qube Research & Technologies (opens in a new tab) (QRT) and LSEG (opens in a new tab), including QRT’s Trading and Risk Management training sessions and portfolio-optimisation training on LSEG Workspace.


Education

PhD in Finance

Imperial College London, Imperial Business School

Supervisors: Prof. Paolo Zaffaroni (opens in a new tab) (main) and Prof. Pasquale Della Corte (opens in a new tab)

Thesis: No-Arbitrage IPCA: A Framework for Cross-Sectional Asset Pricing. Available on request.

Doctoral programme in the Department of Finance, including an MRes in Finance with Distinction (2020); PhD conferred August 2026 · Fully funded doctoral scholarship

M.A. in Economics

Columbia University

Master’s thesis: Diffusion Index Forecasting: A Robust Estimator for Common Shock, supervised by Prof. Jushan Bai (opens in a new tab)

B.S., double major in Economics and Mathematics

University of Michigan, Ann Arbor

Two full majors: Economics; Mathematics (Mathematics of Finance and Risk Management track) · University Honors

Research positions

Visiting Researcher

Imperial Centre of Excellence in Quantitative Finance (opens in a new tab), Department of Finance, Imperial Business School, Imperial College London

Host: Prof. Robert Kosowski (opens in a new tab), Co-Director of the Centre

Research agenda for the visit: economically constrained machine learning for cross-sectional asset pricing and portfolio choice.

Research Assistant, macro forecasting

Department of Economics, Columbia University

Diffusion-index and factor models that extract common inflation and interest-rate factors from large mixed-frequency macro data; robust PCA for missing data, revisions, outliers and structural breaks.

Research Assistant, derivatives pricing

Department of Mathematics, University of Michigan

Real-option valuation of a gold mine, with the Lihir Gold Limited IPO as the case, priced with a binomial tree.

References

Professor Paolo Zaffaroni (opens in a new tab)

Professor of Financial Econometrics, Department of Finance, Imperial Business School, Imperial College London

PhD supervisor (main) · p.zaffaroni@imperial.ac.uk

Professor Pasquale Della Corte (opens in a new tab)

Professor of Finance, Imperial Business School, Imperial College London

PhD supervisor · p.dellacorte@imperial.ac.uk

Professor Robert Kosowski (opens in a new tab)

Professor of Finance, Imperial Business School, Imperial College London; Co-Director, Imperial Centre of Excellence in Quantitative Finance

Host of the visiting-researcher appointment · r.kosowski@imperial.ac.uk

Contact

Email
yang.liu19@imperial.ac.uk
Academic CV
English (PDF), opens in a new tab · 中文 (PDF), Chinese, opens in a new tab
Imperial profile
profiles.imperial.ac.uk/yang.liu19 (opens in a new tab)
LinkedIn
linkedin.com/in/mingyang-buweinan (opens in a new tab)
ORCID
0009-0008-5418-2563 (opens in a new tab)
Also listed as
Yang Liu (SSRN listings)
Full research site
mingyangliu.org

Placement contacts

Dr Savitar Sundaresan (opens in a new tab)

Associate Professor of Finance, Imperial Business School, Imperial College London

Faculty placement contact · s.sundaresan@imperial.ac.uk · +44 20 7594 6449

Ms Kim Hart

Departmental Operations Coordinator, Imperial Business School, Imperial College London

Placement administrator (CVs and reference letters) · k.hart@imperial.ac.uk

Interactive figures for each paper, the data files behind them and a description of the NA-IPCA toolkit (code available on request) are on mingyangliu.org. See also the academic CV (PDF) and Data & Code.